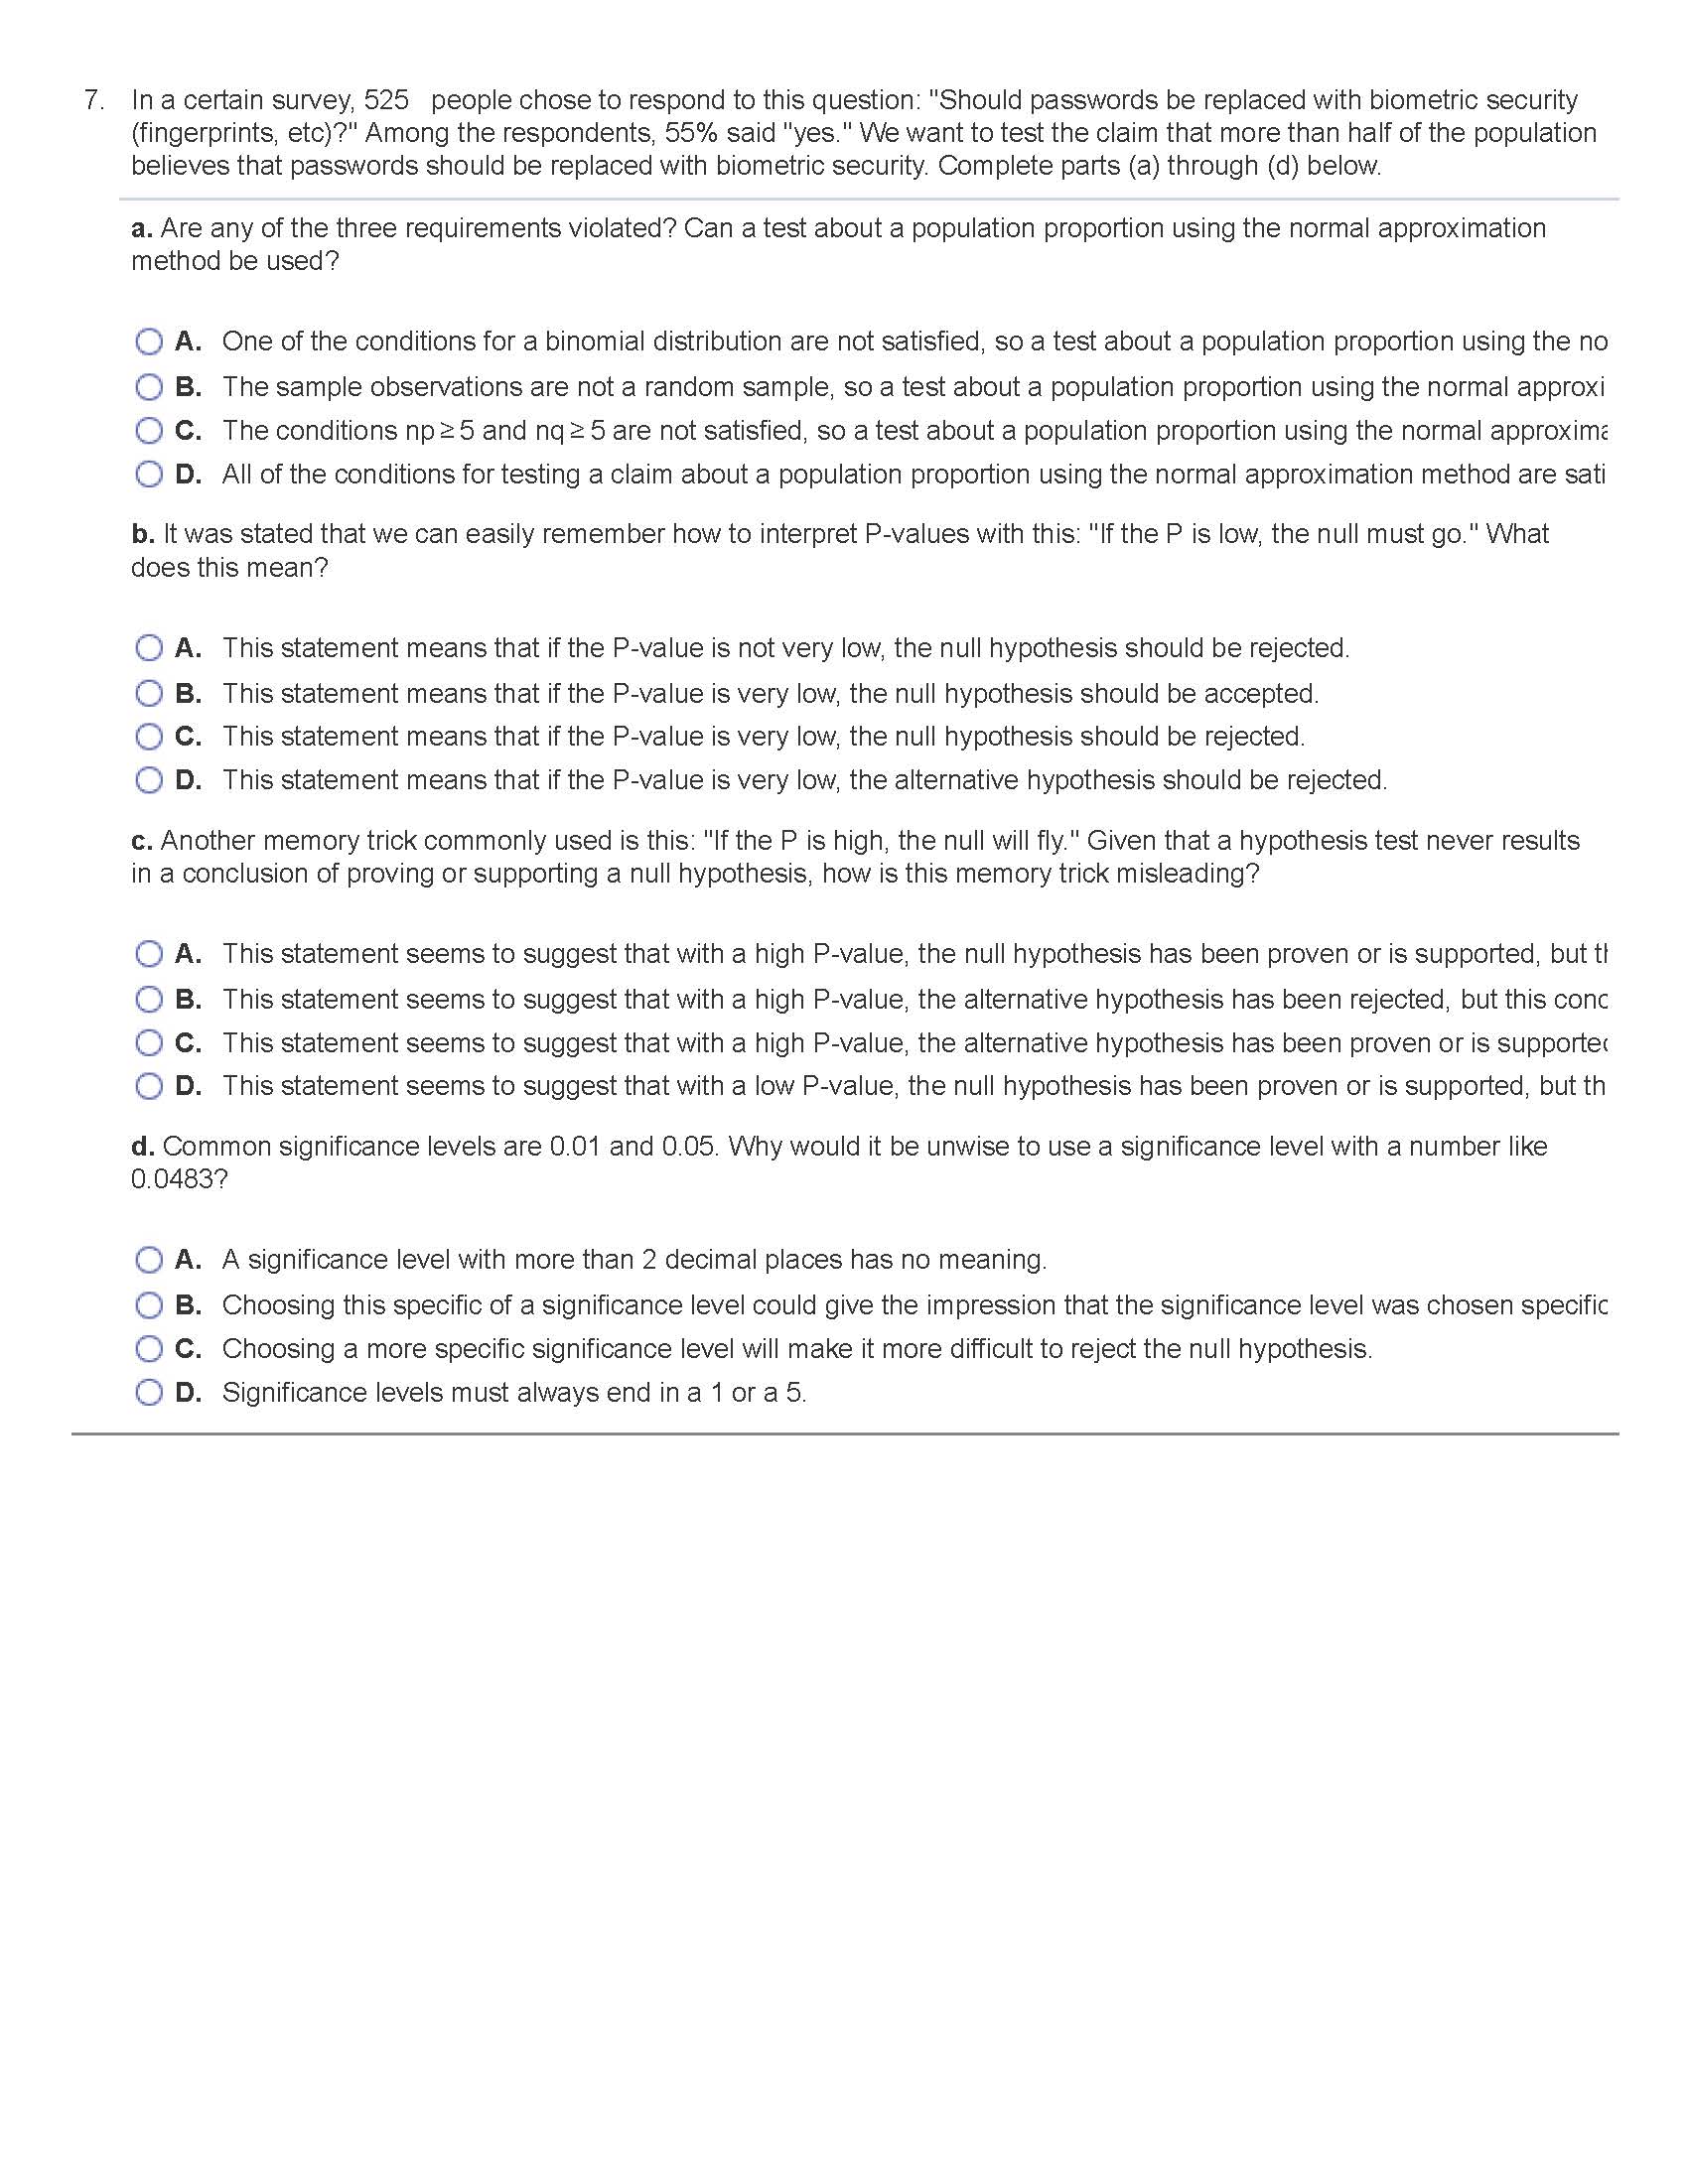
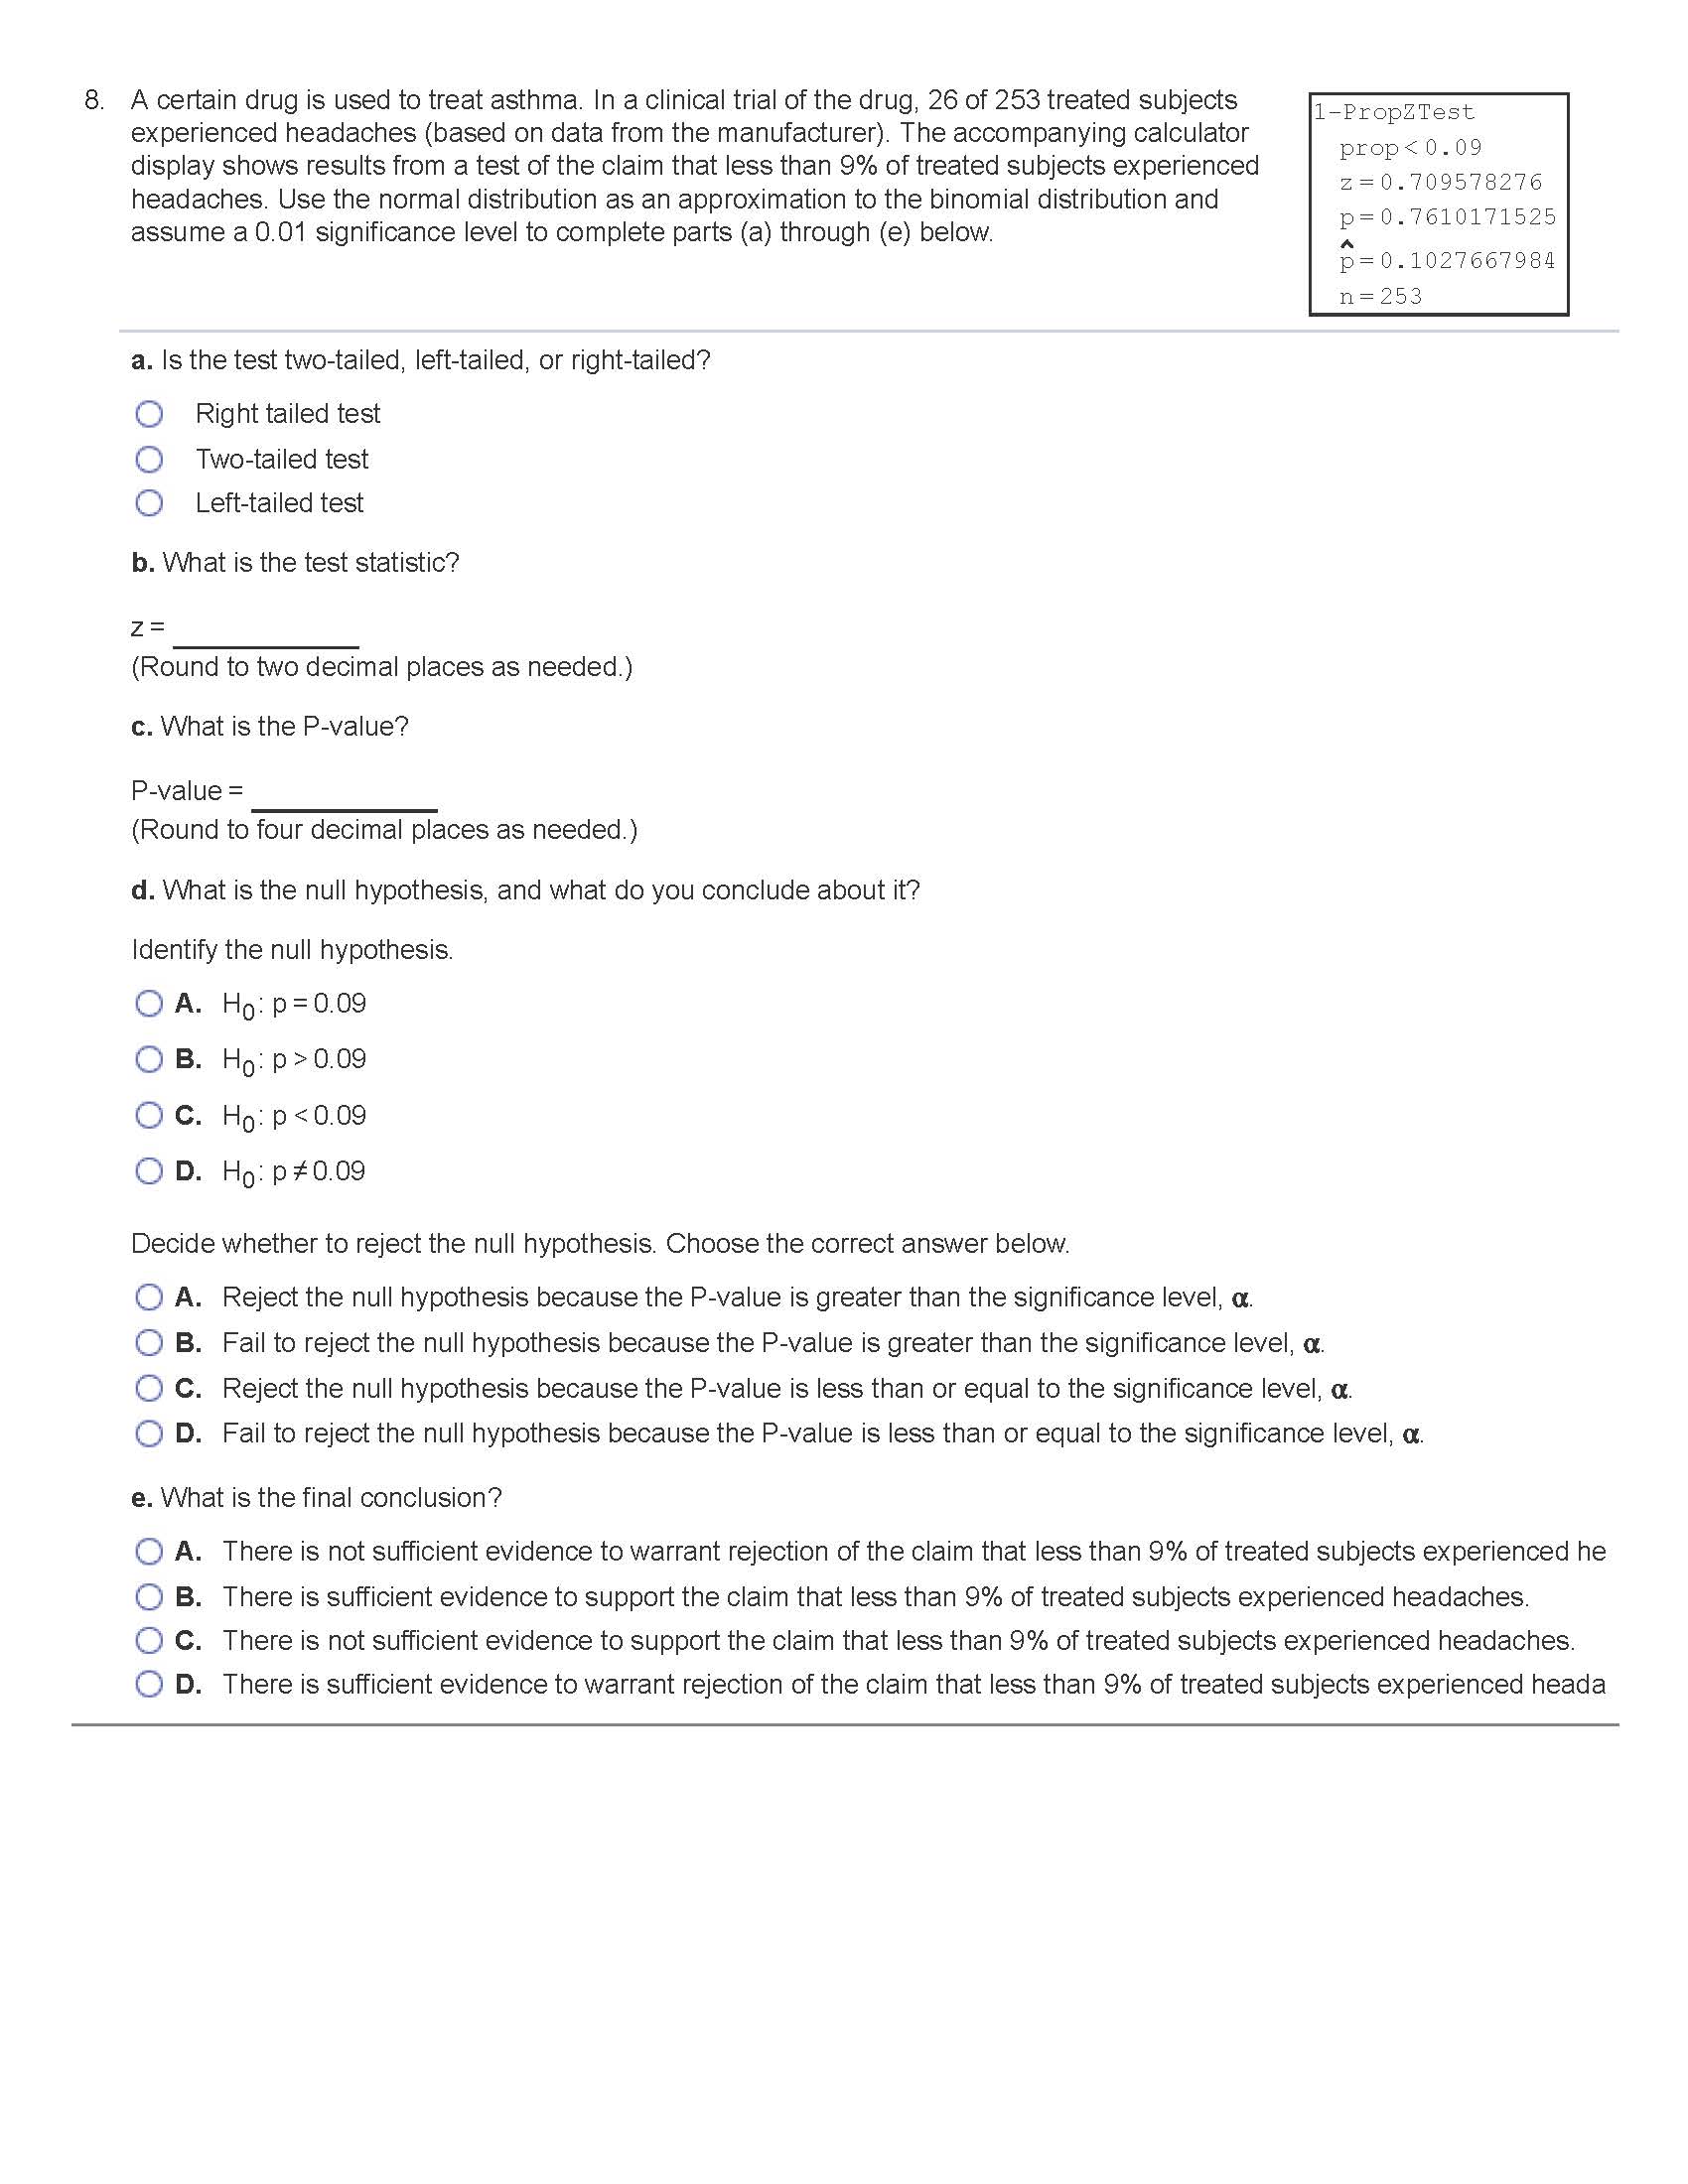
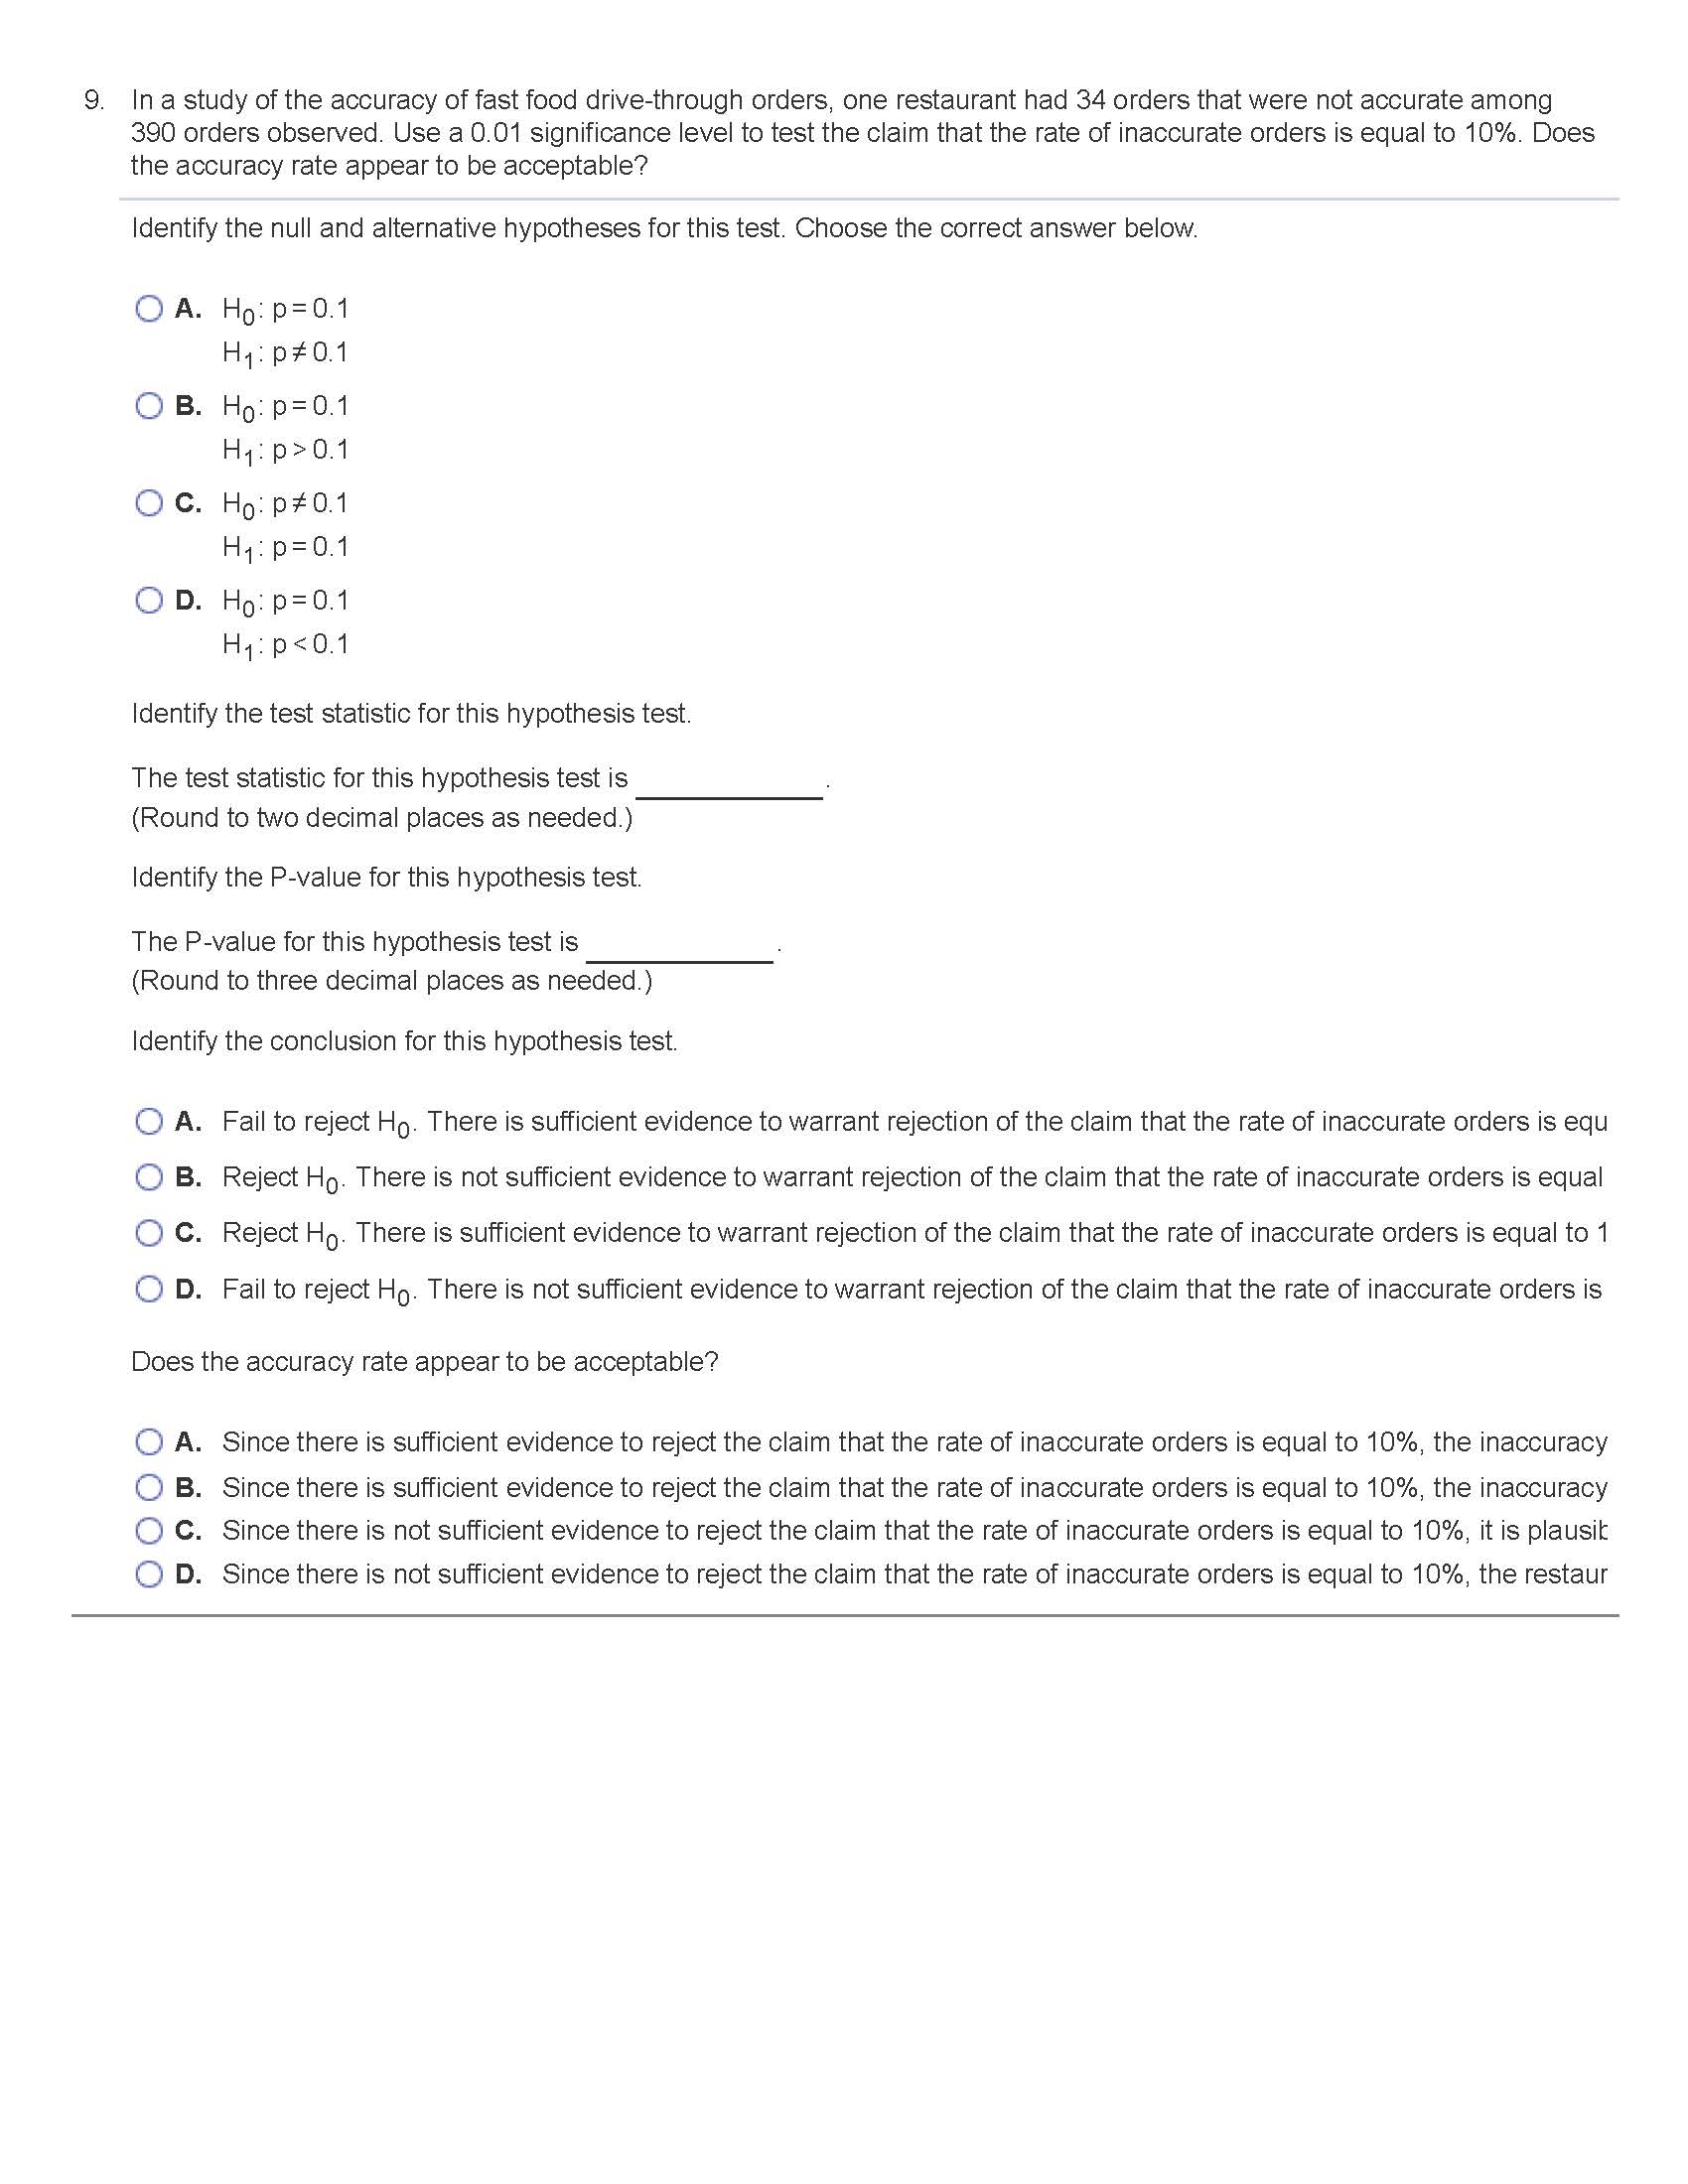
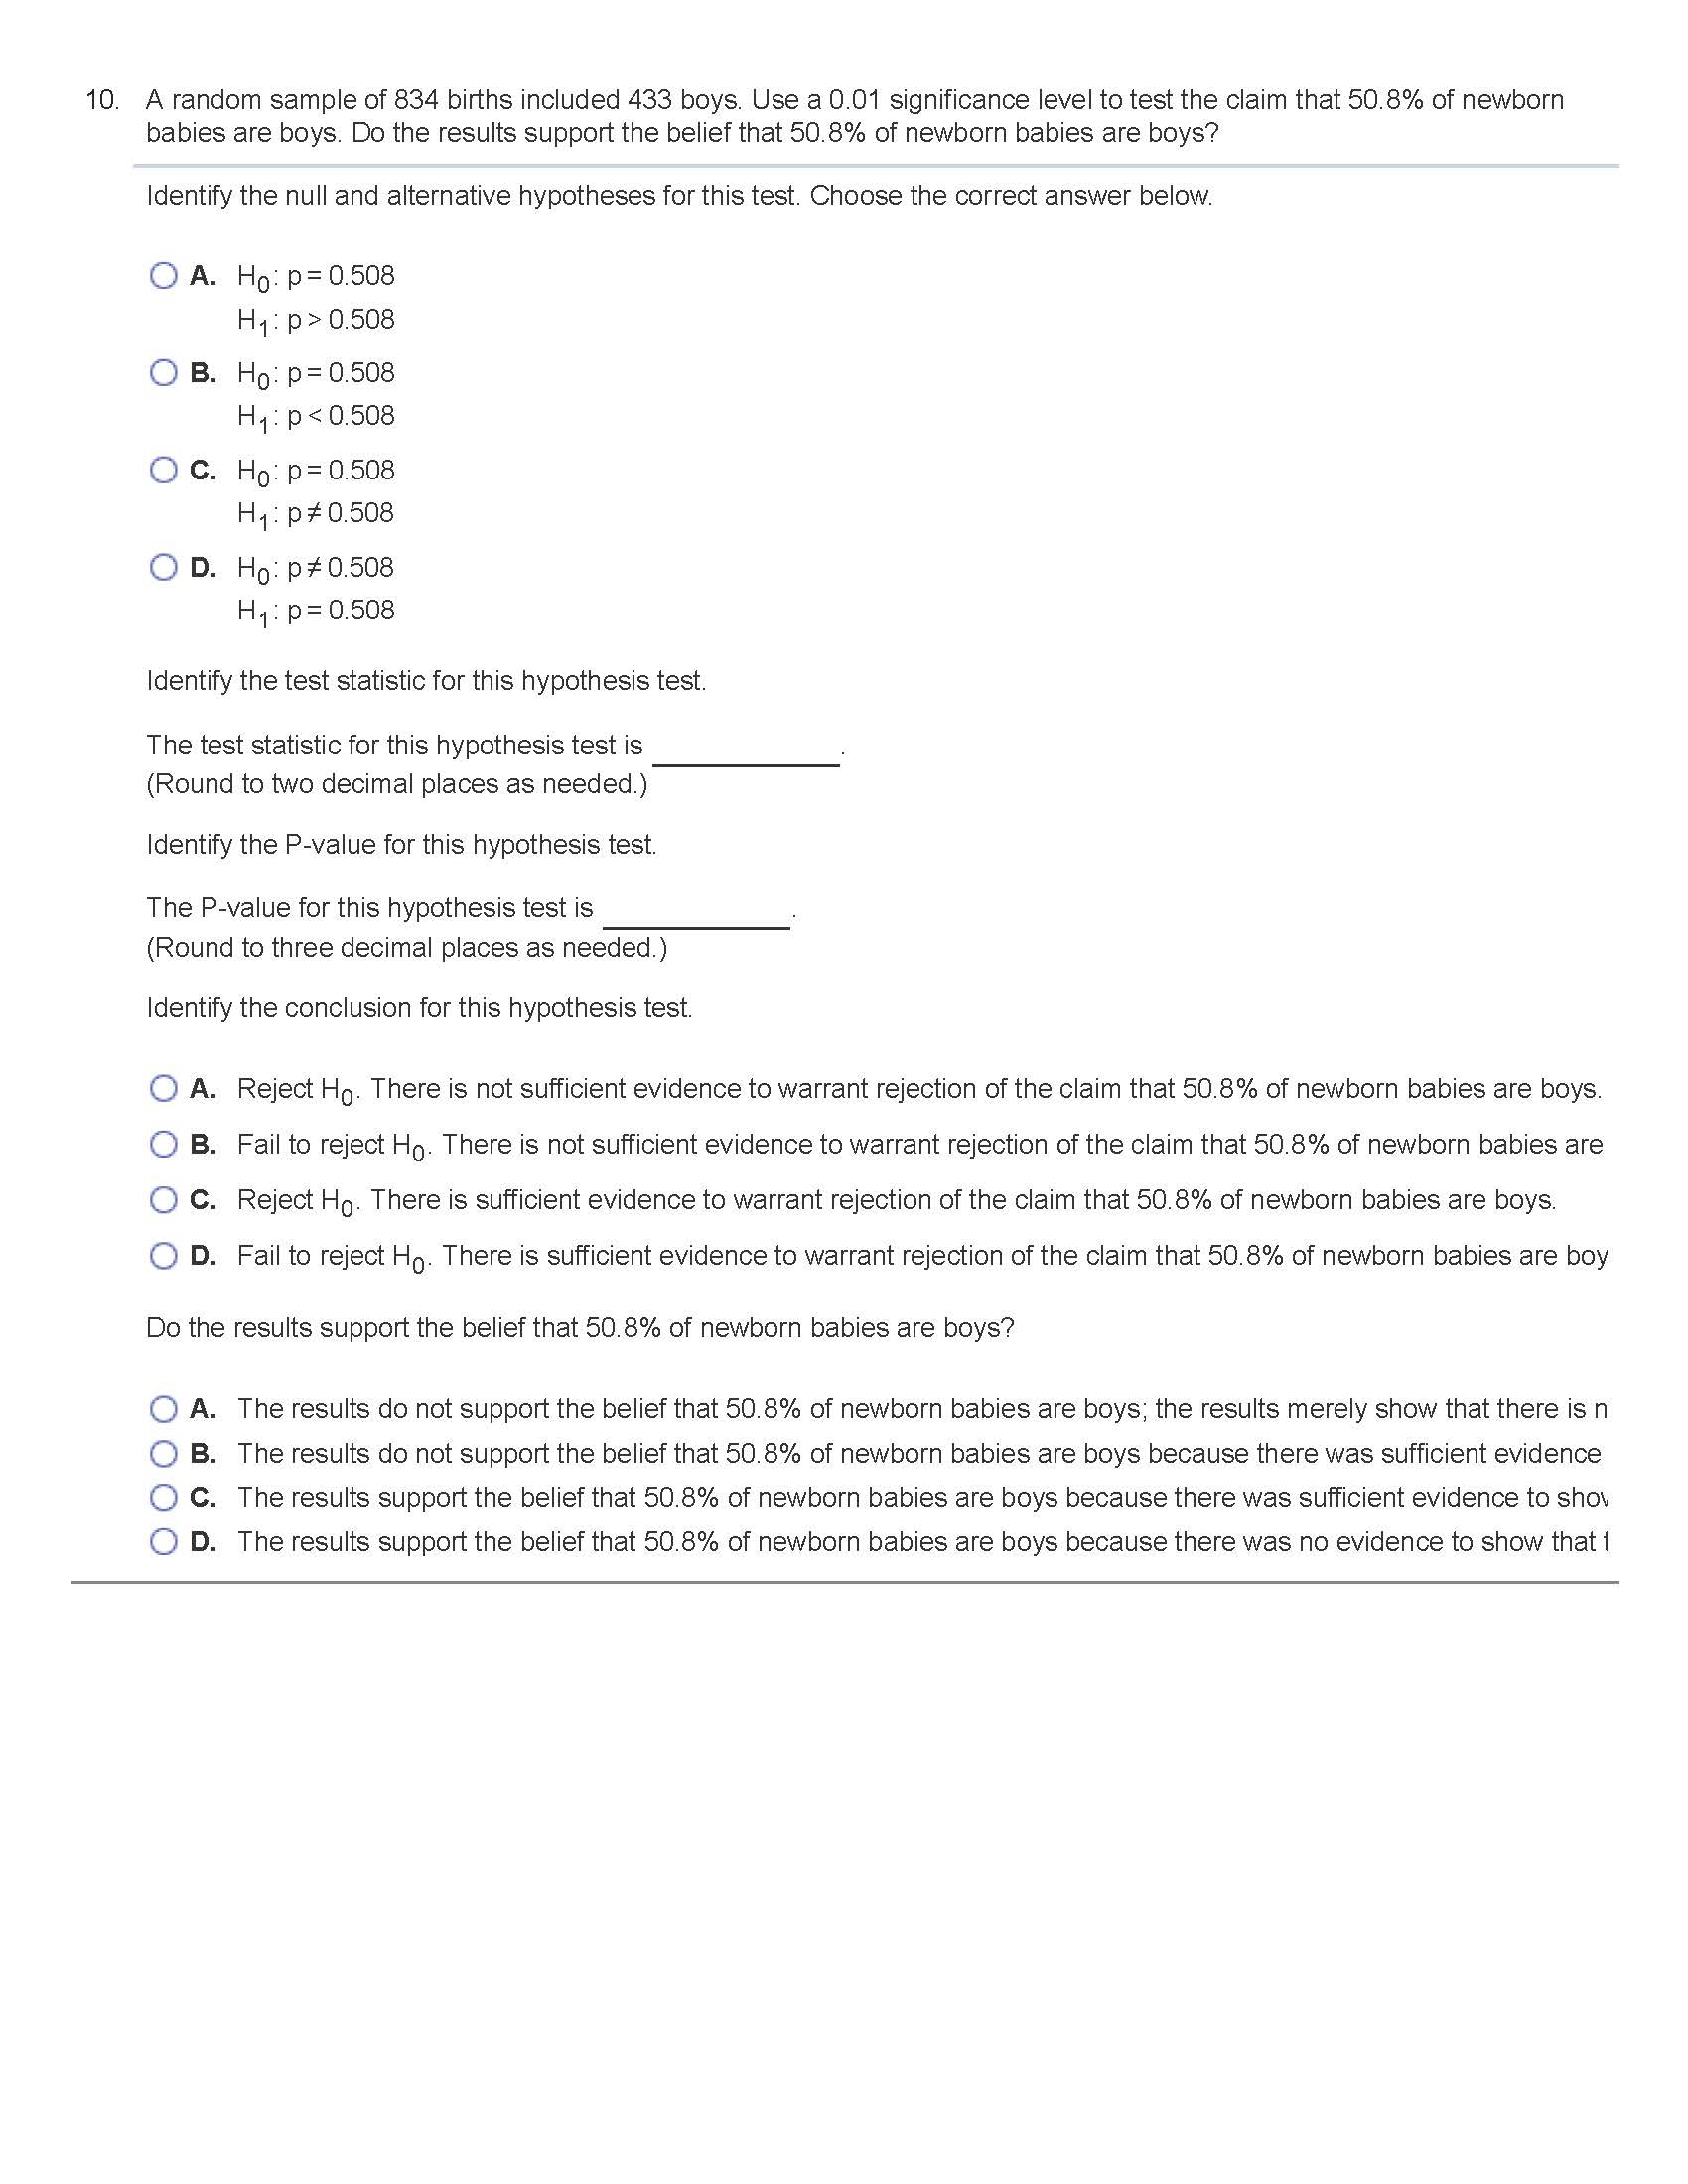
Question: I'm having a hard time understanding this question can you help me, please. I attach a picture of the question I'm having a problem with.
I'm having a hard time understanding this question can you help me, please. I attach a picture of the question I'm having a problem with. Thank you
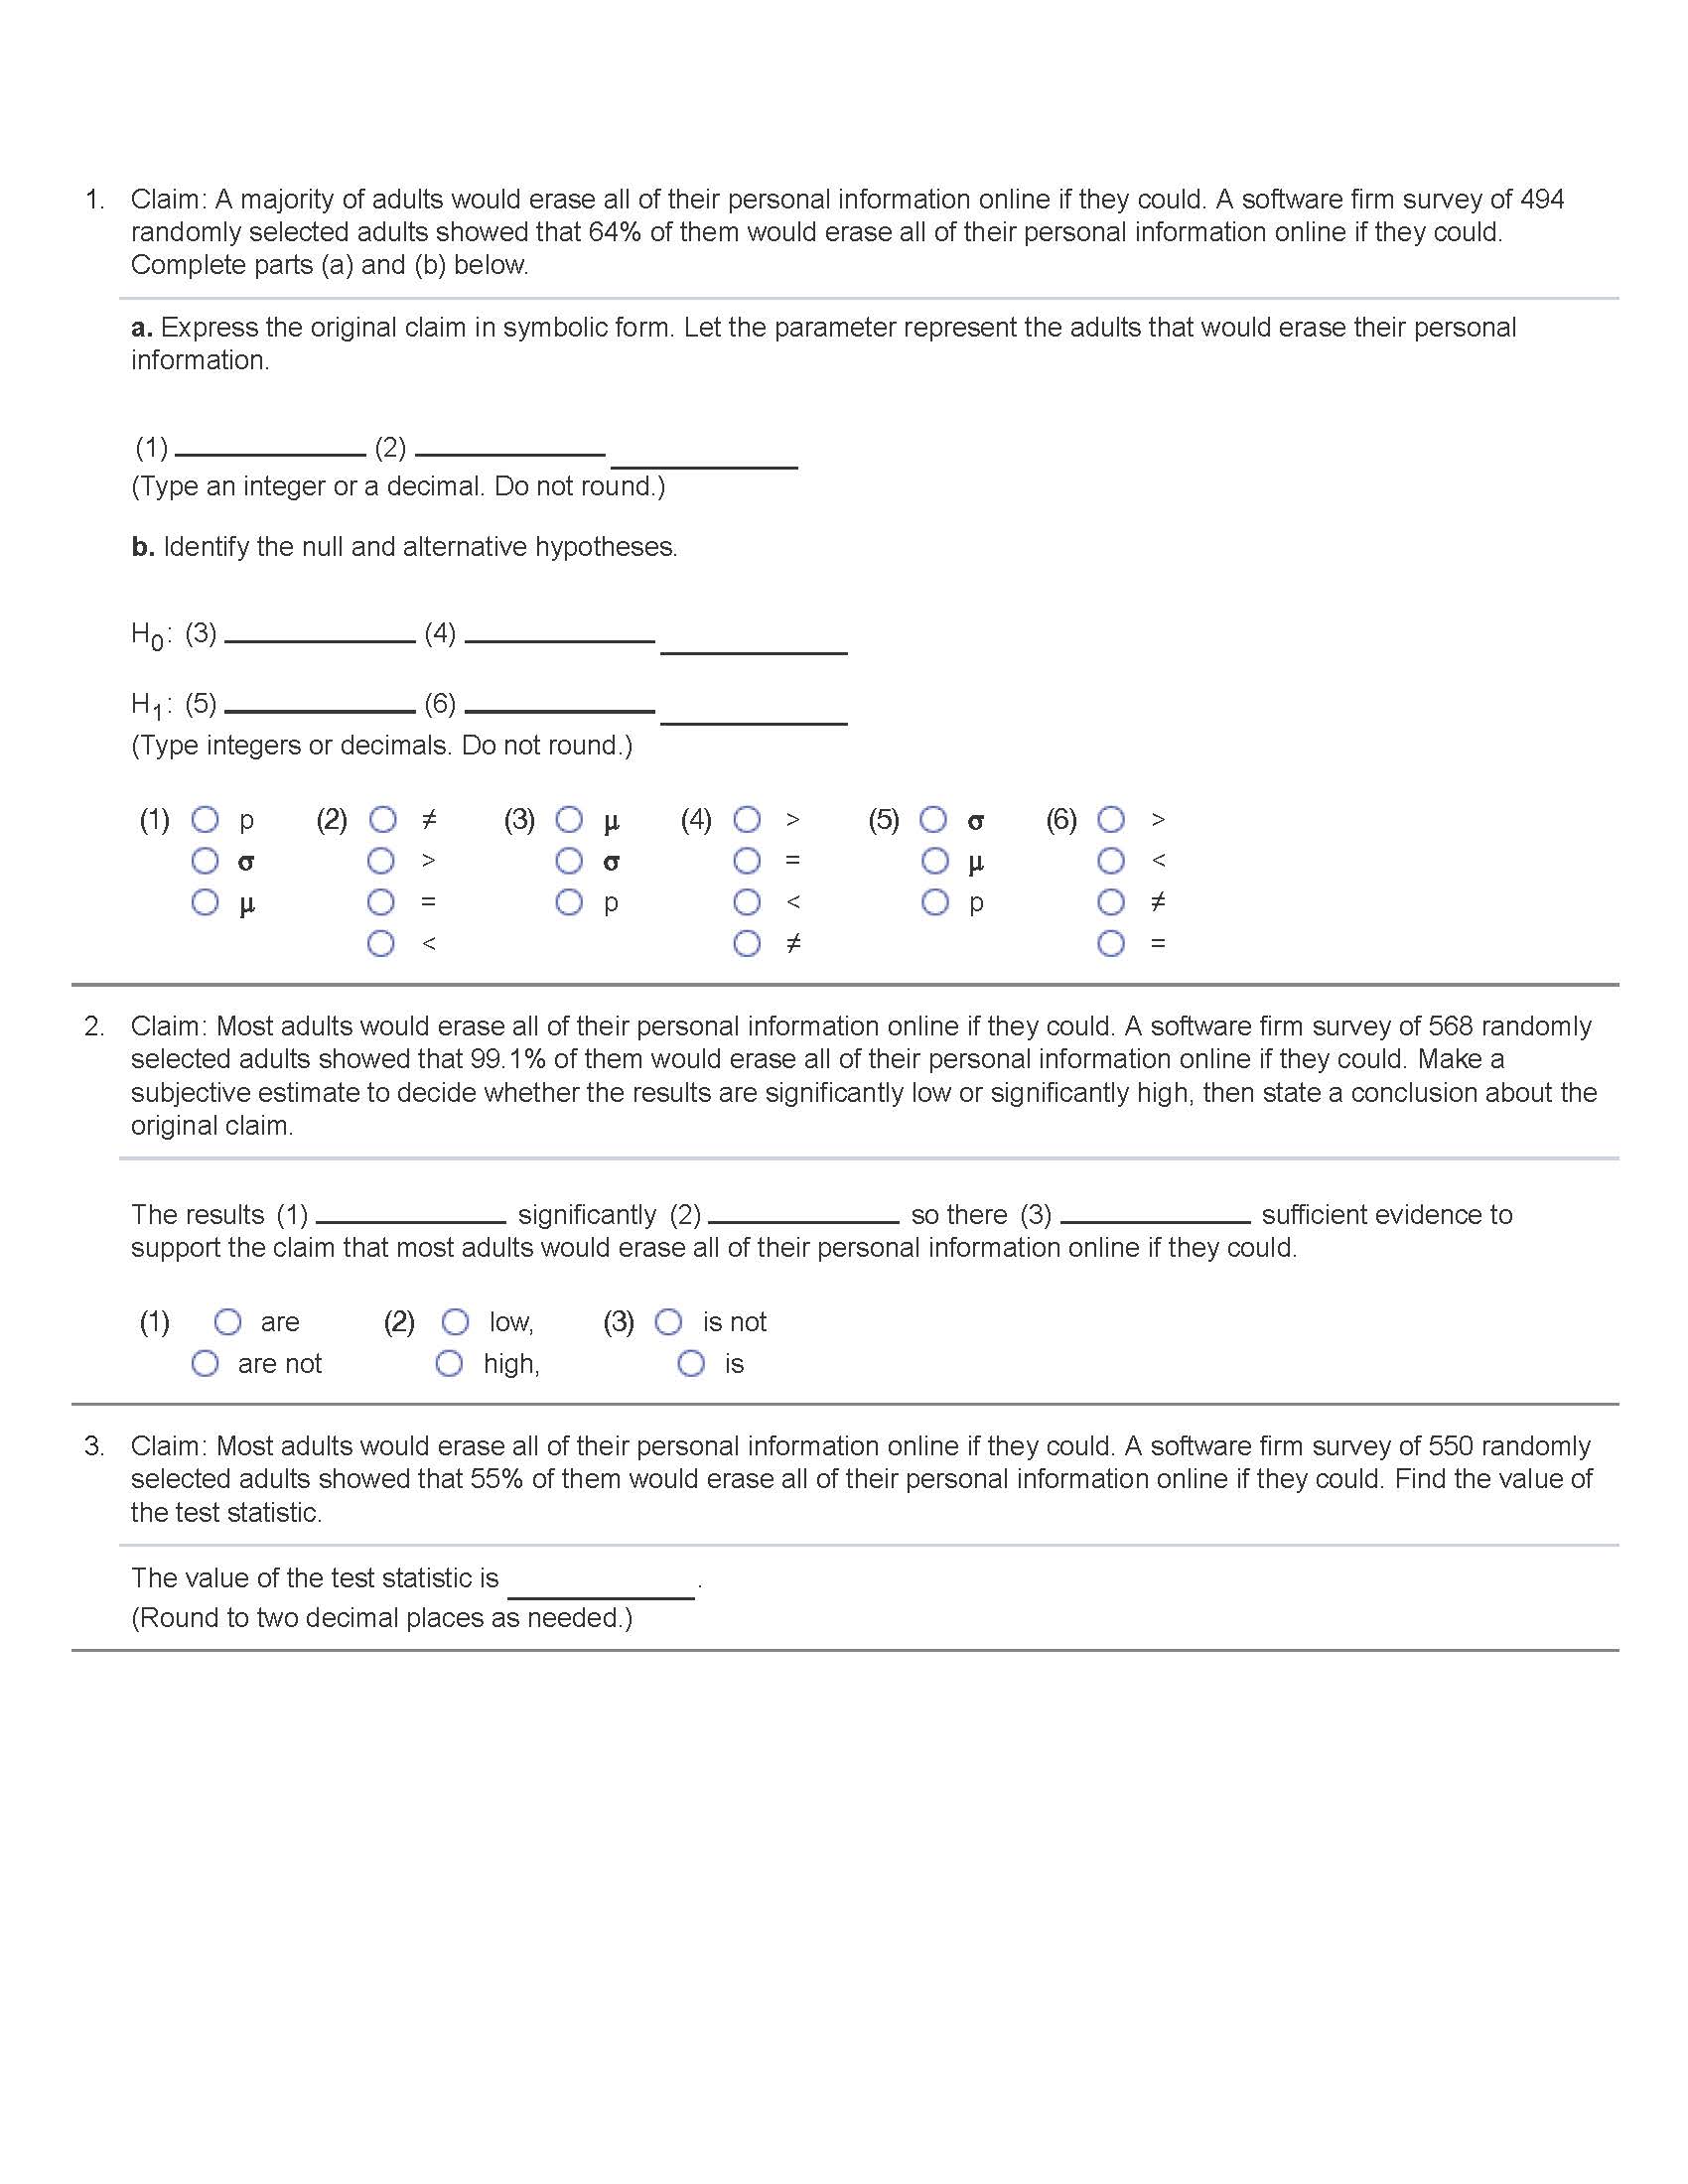
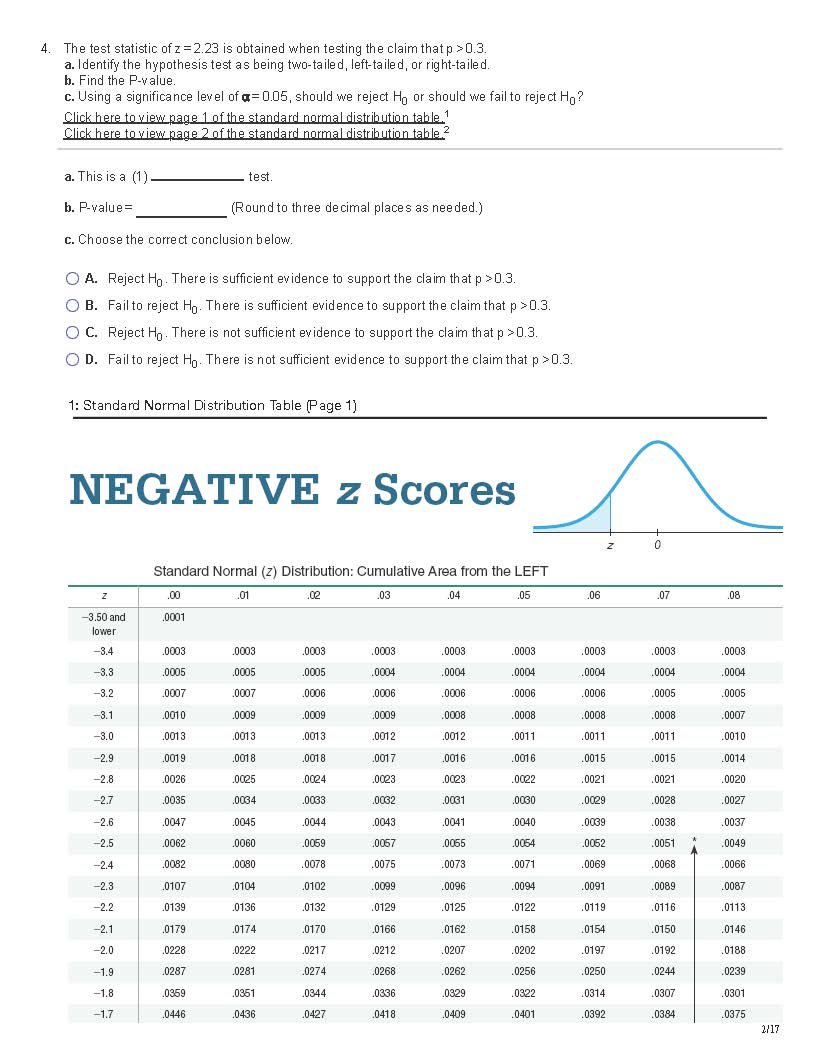
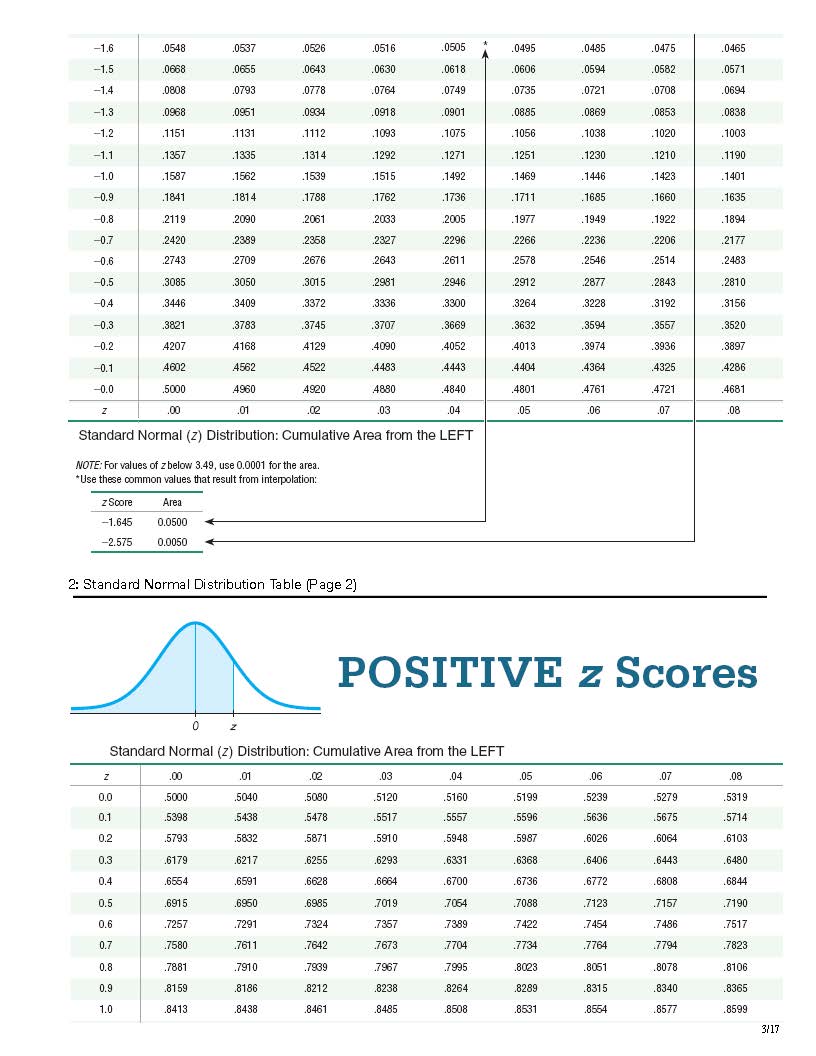
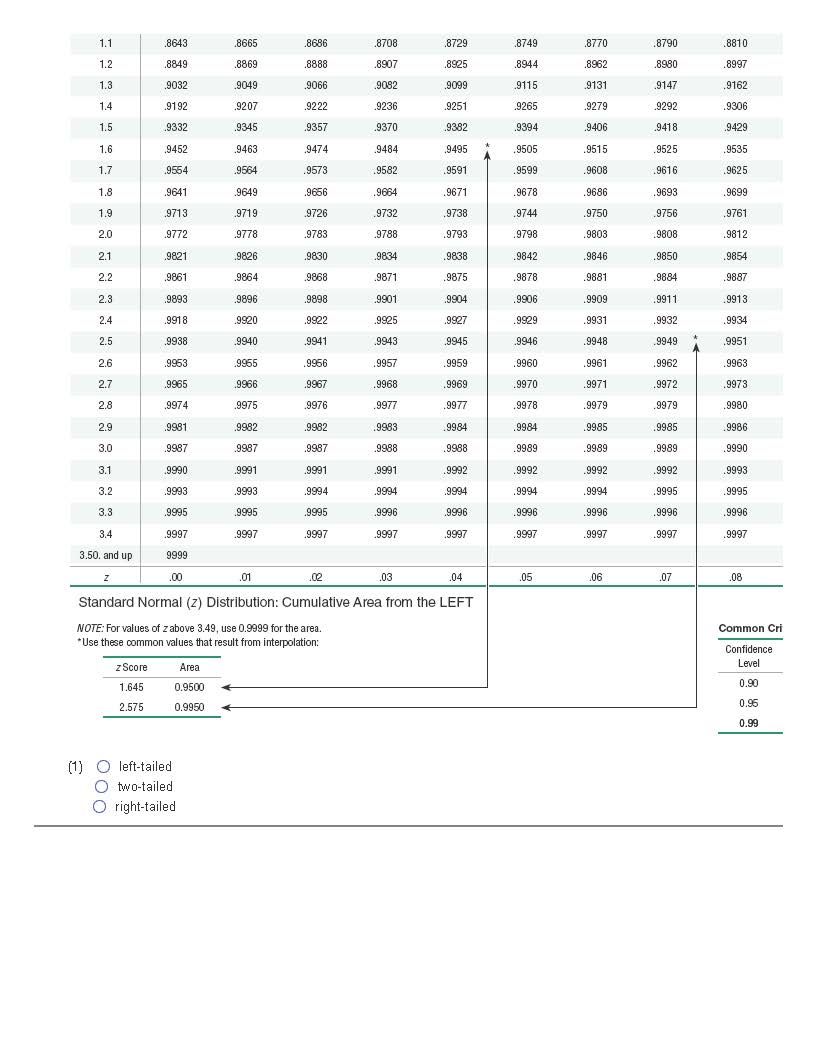
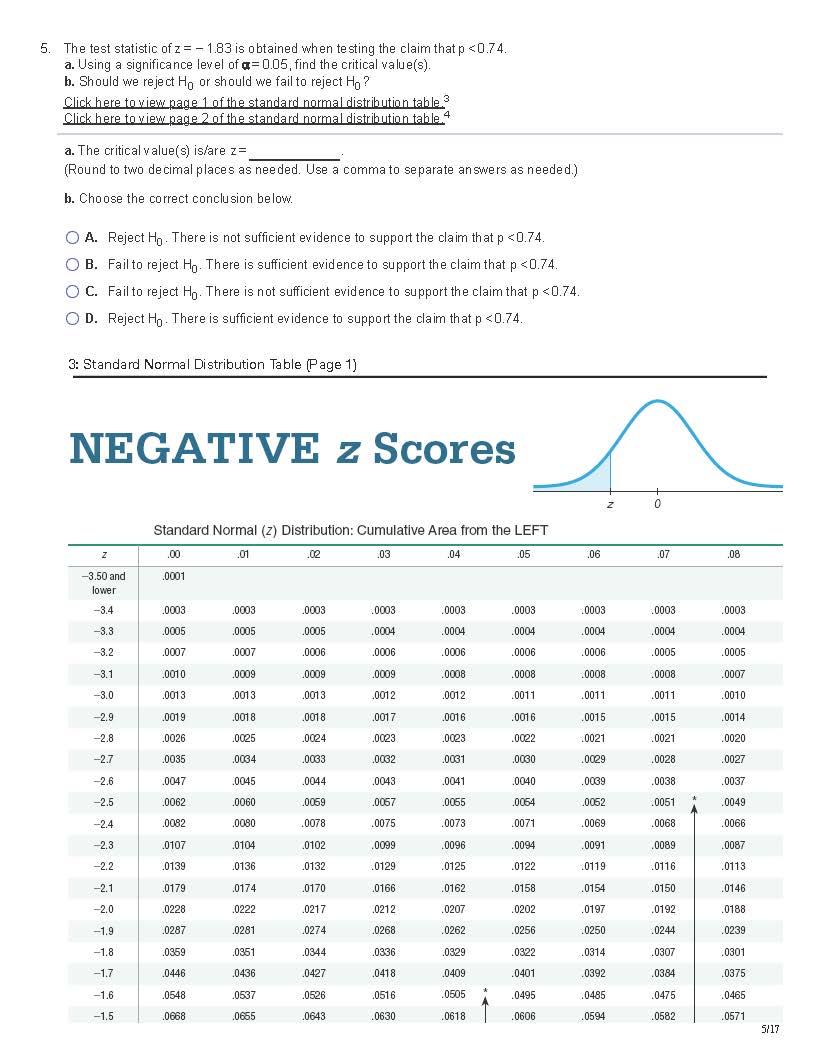
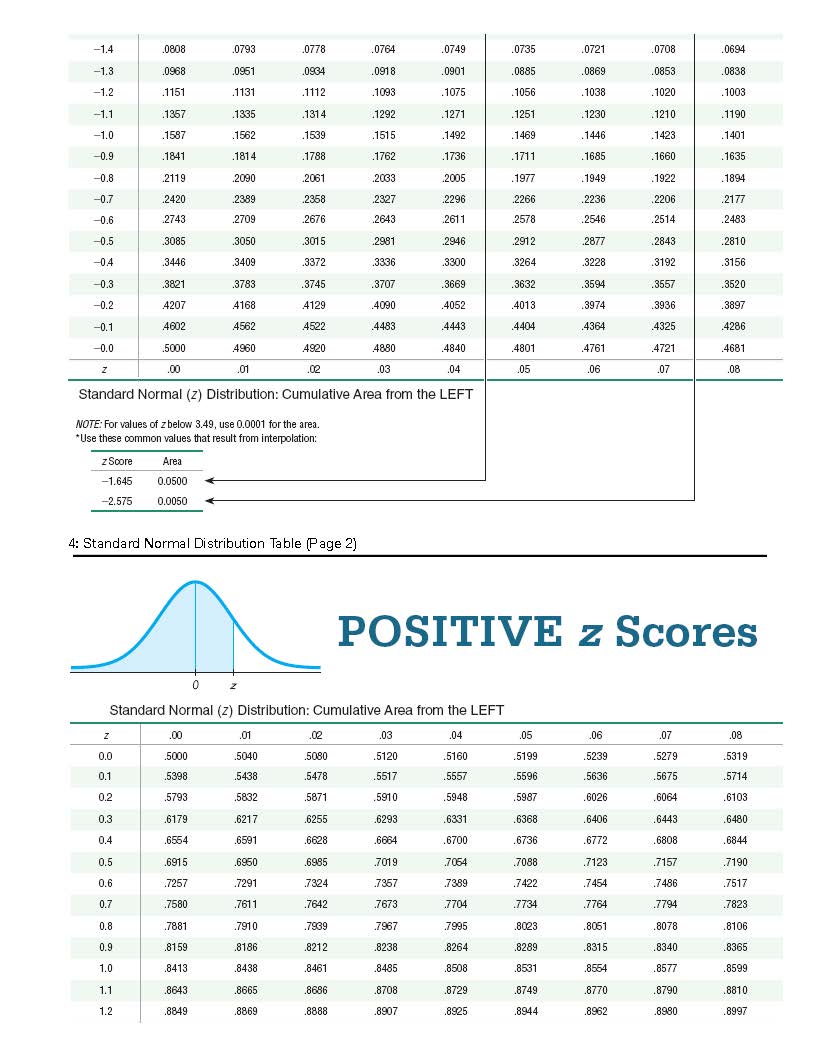
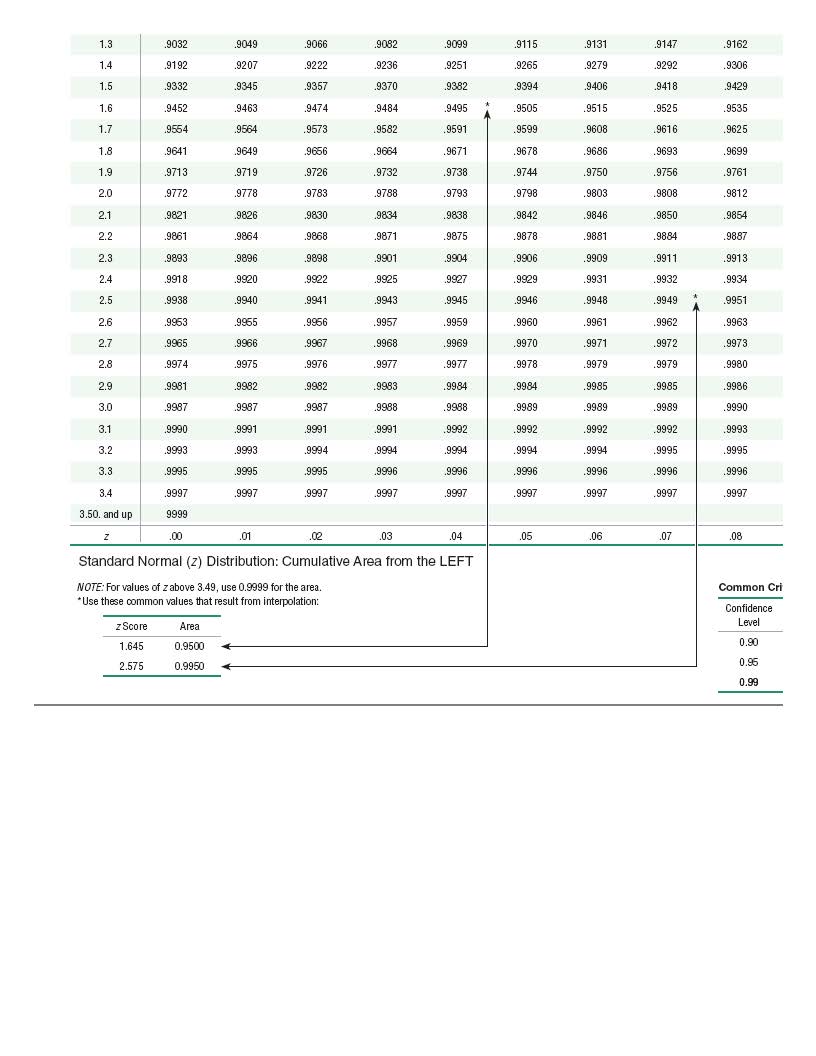
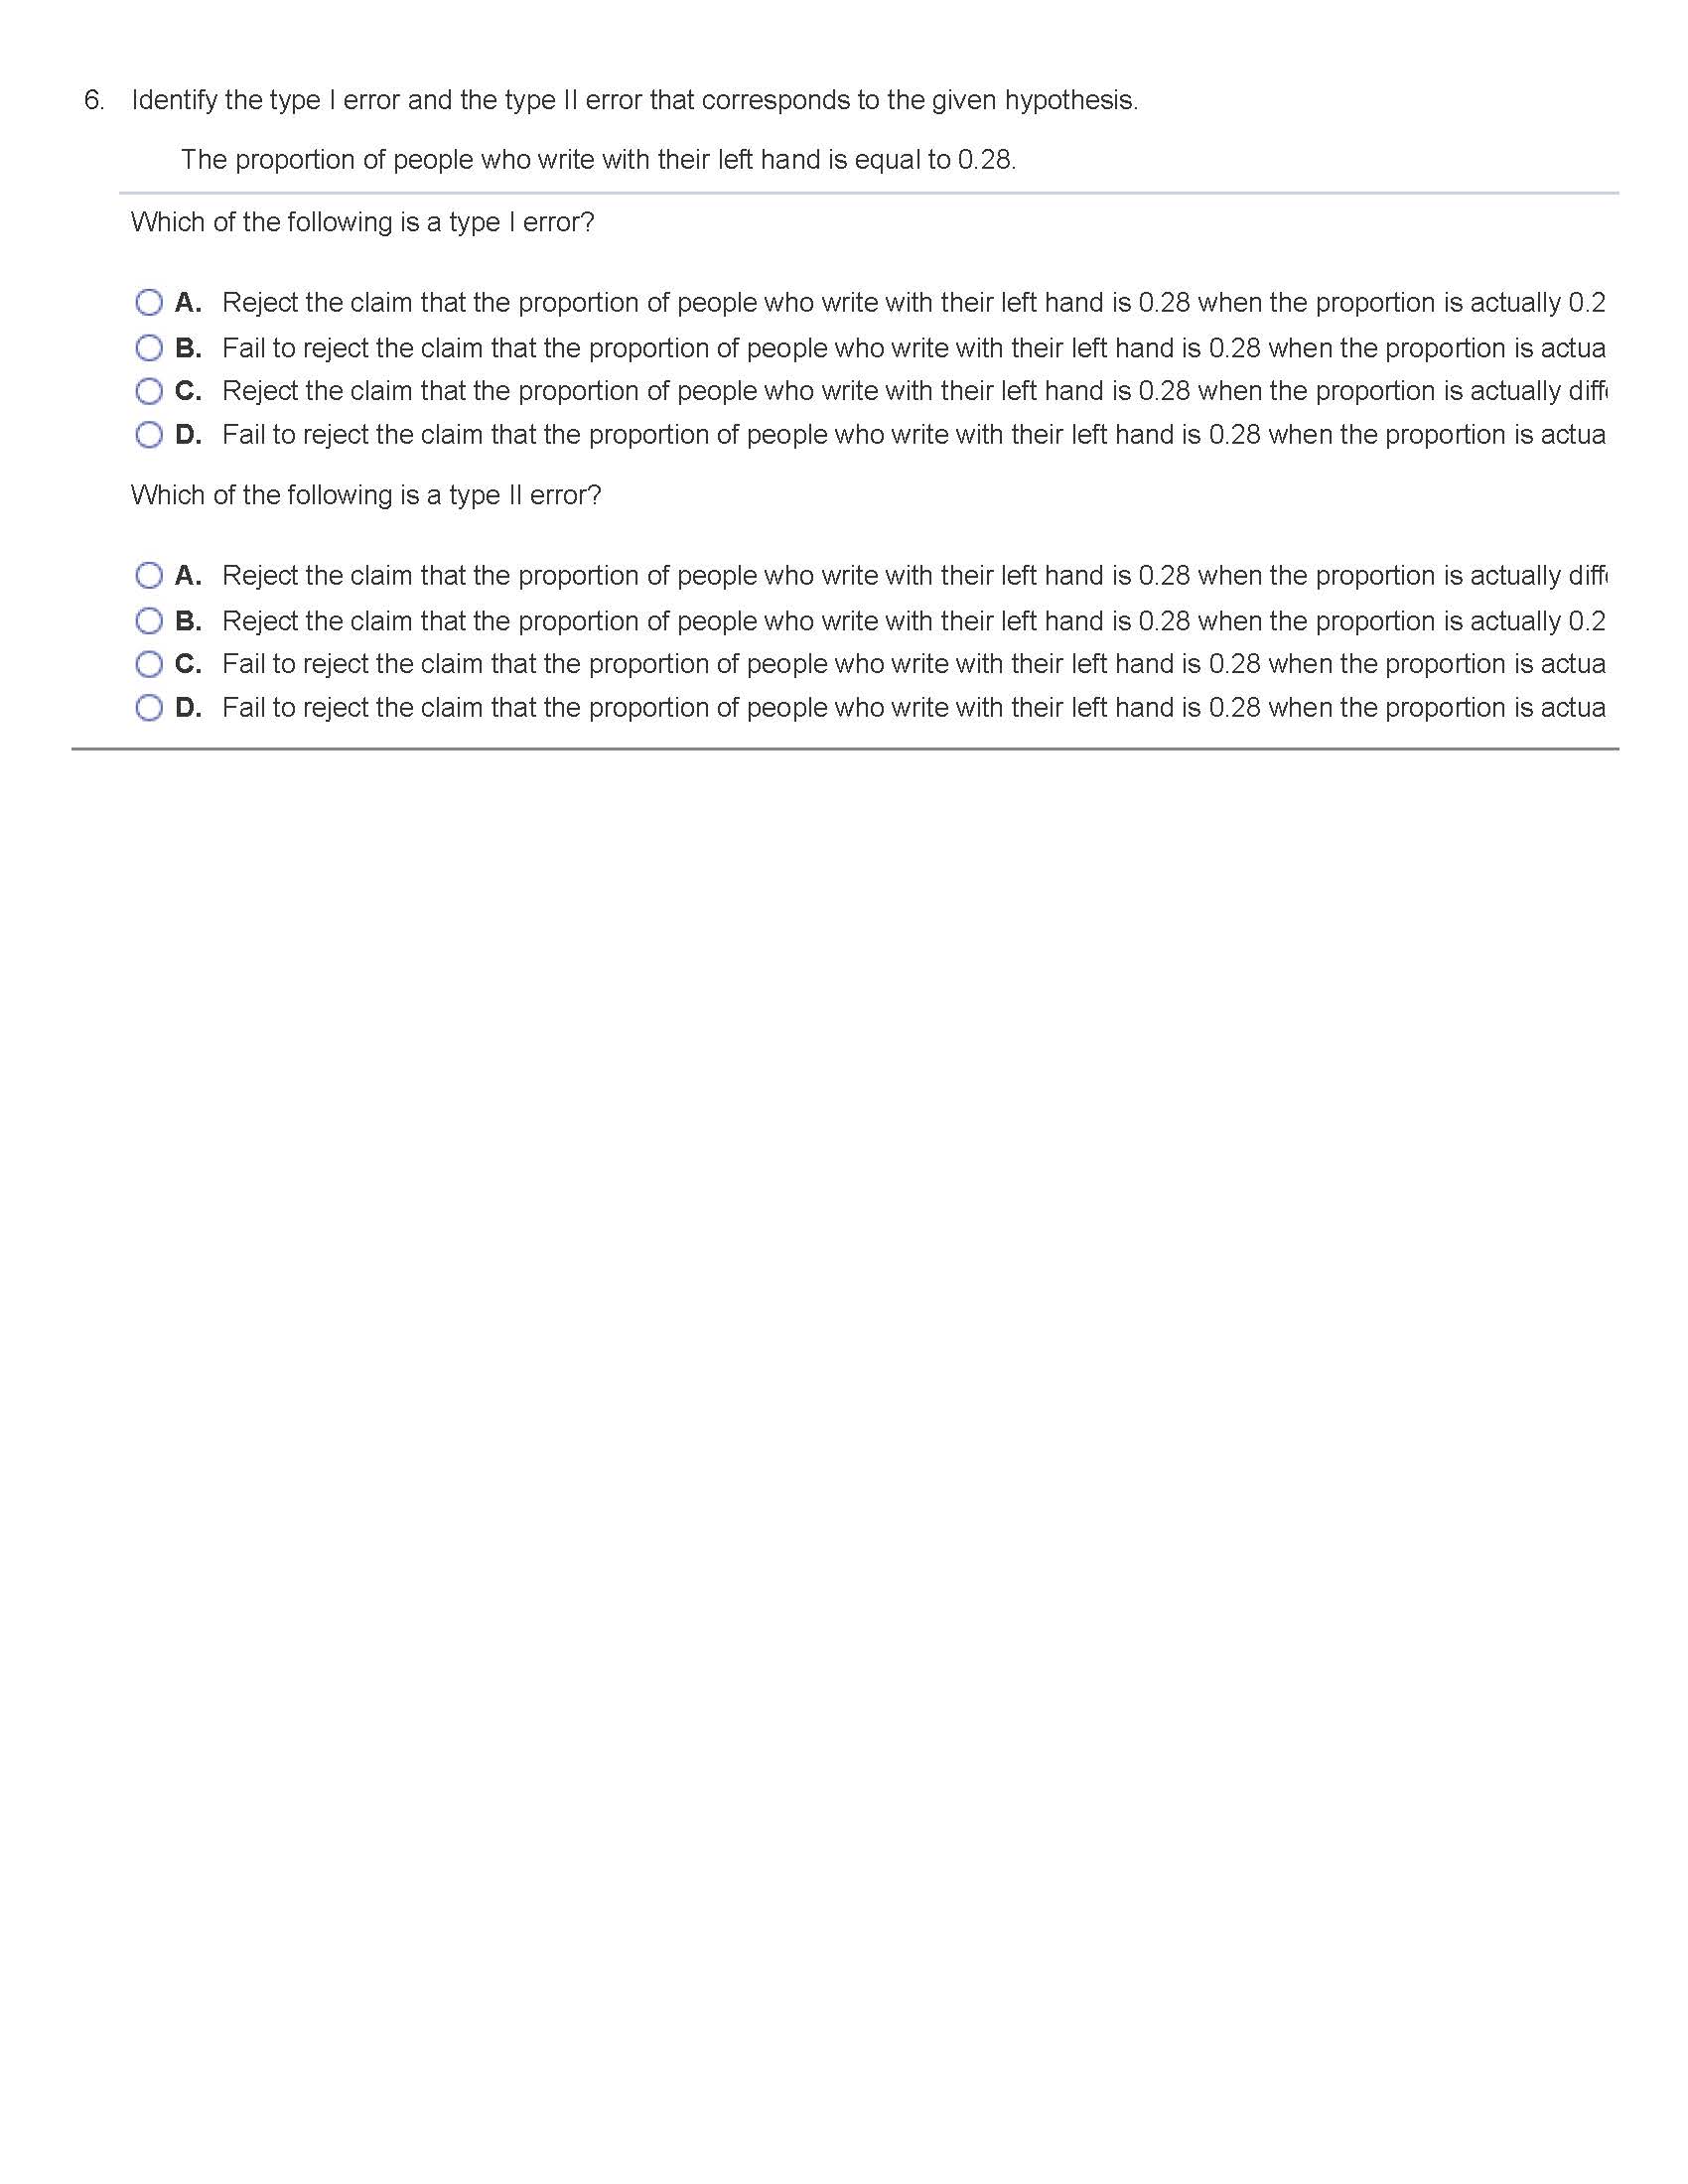
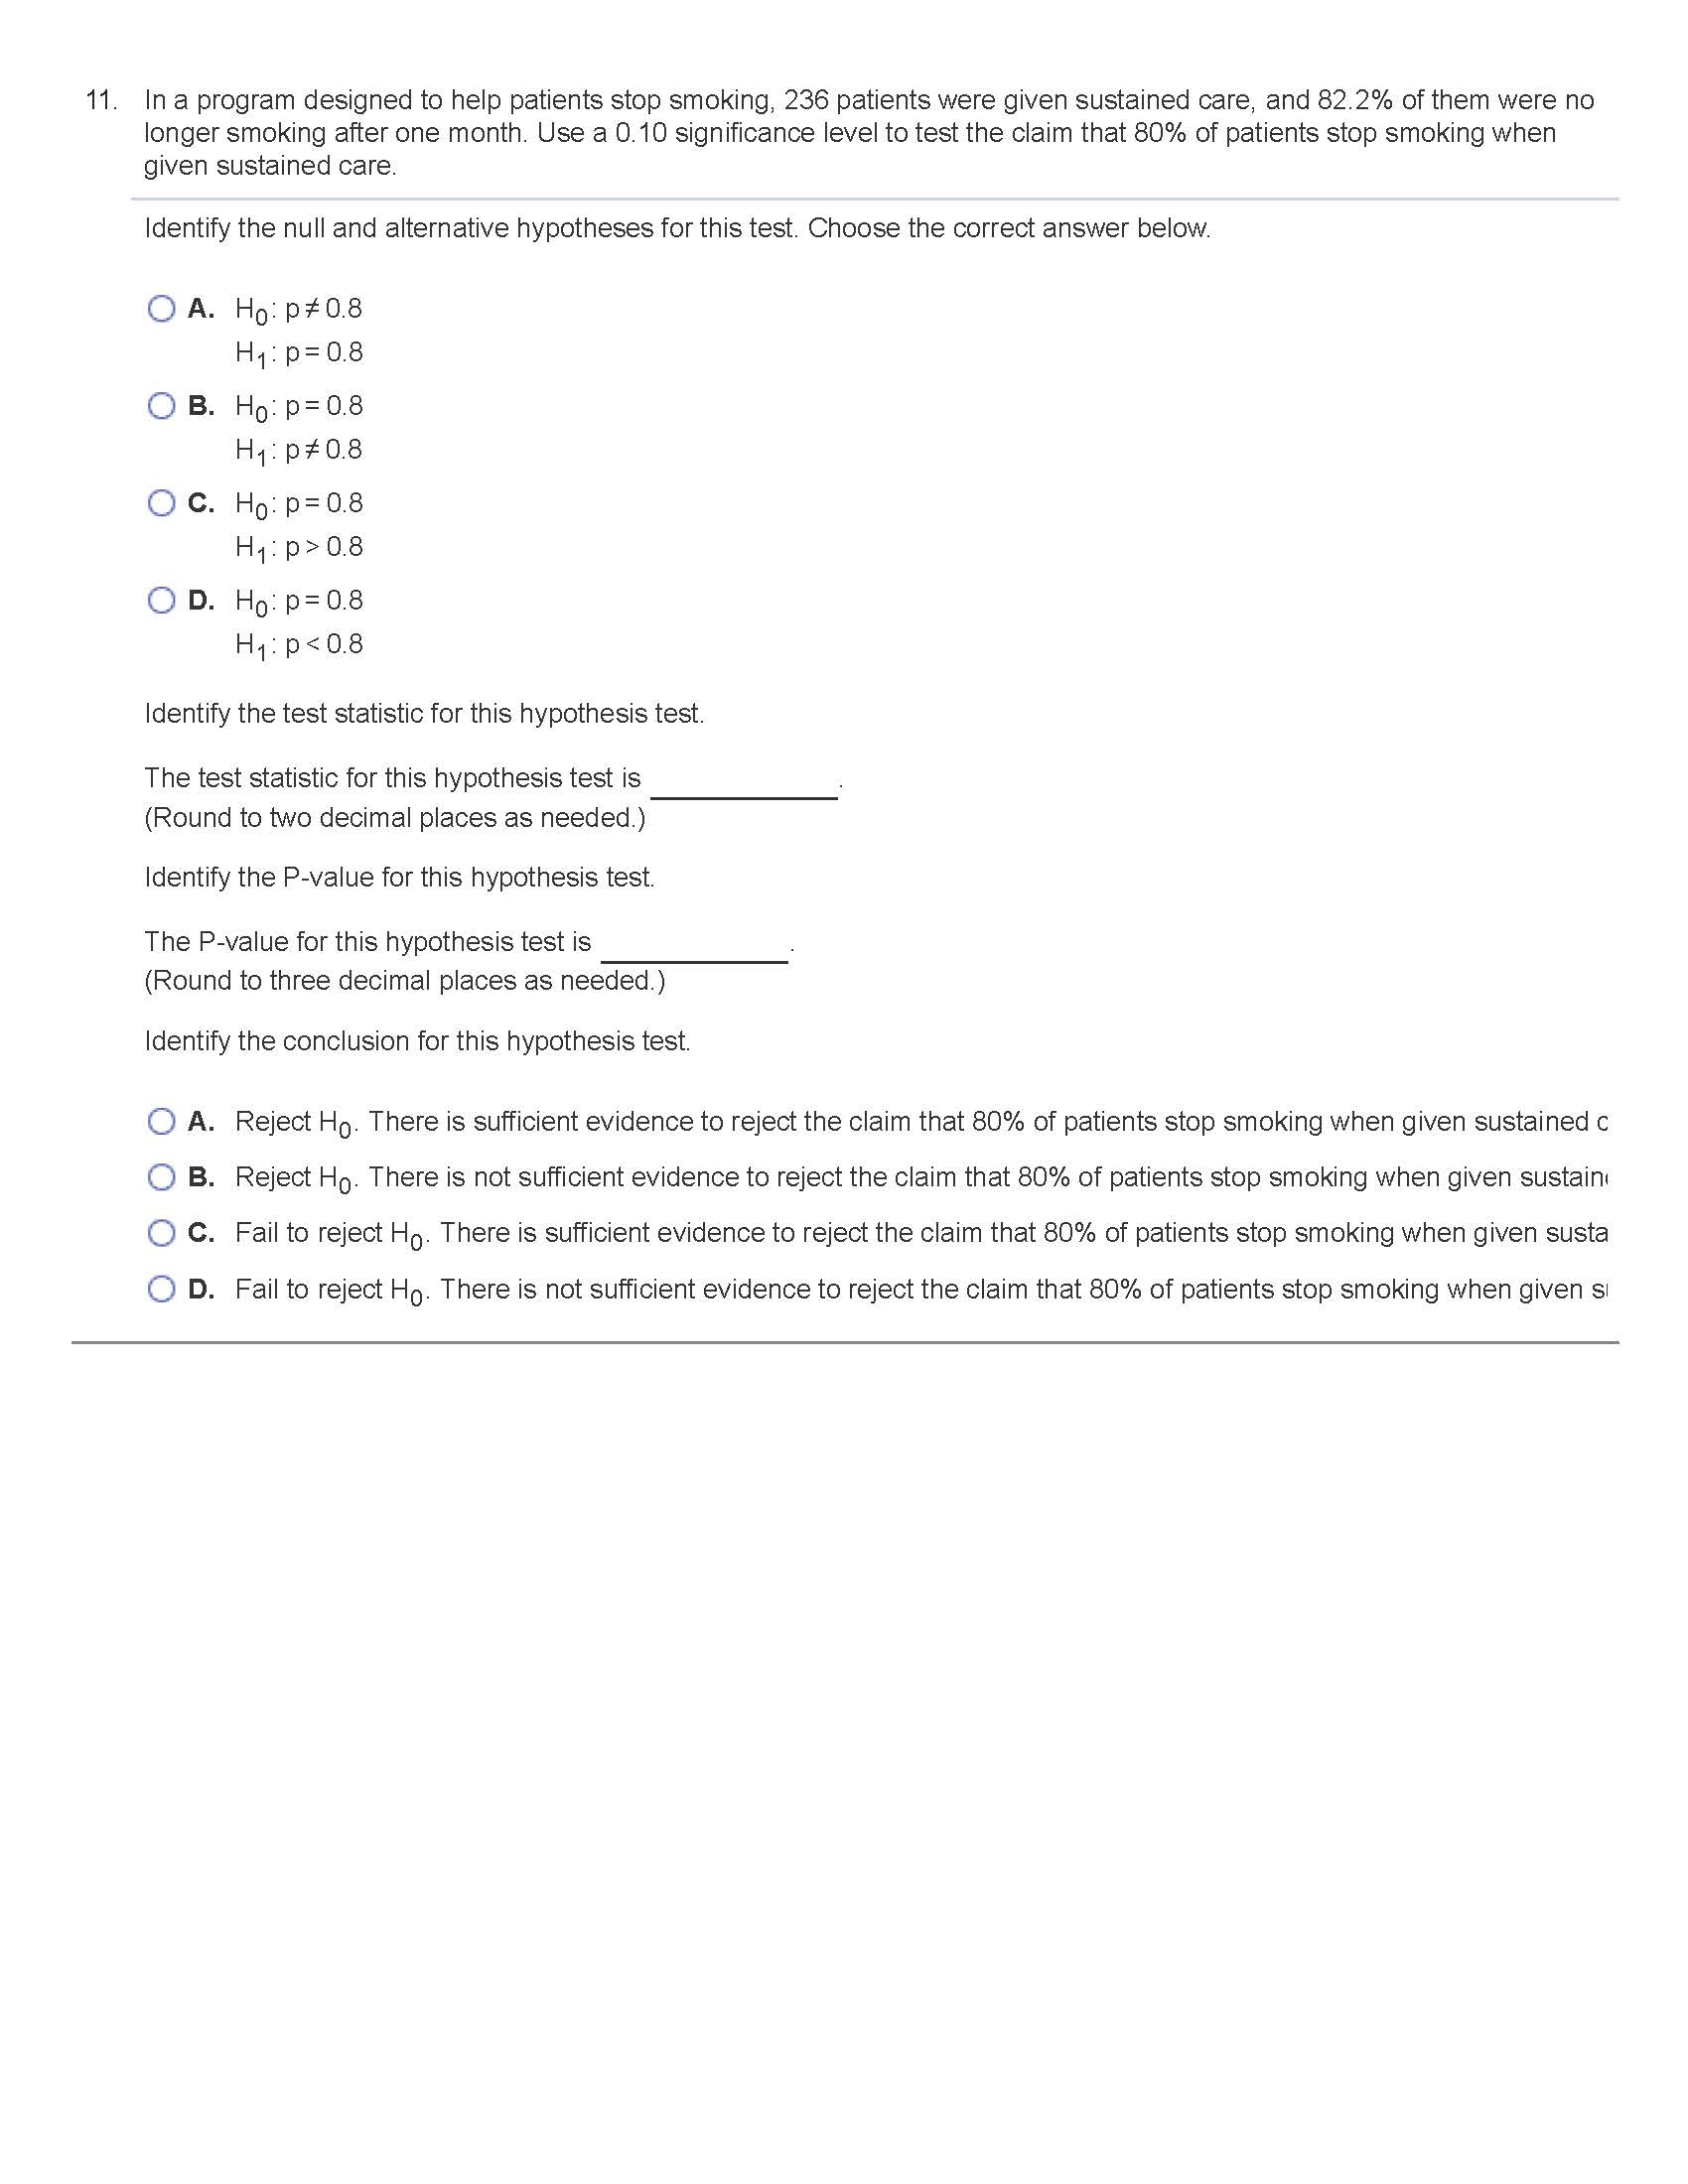
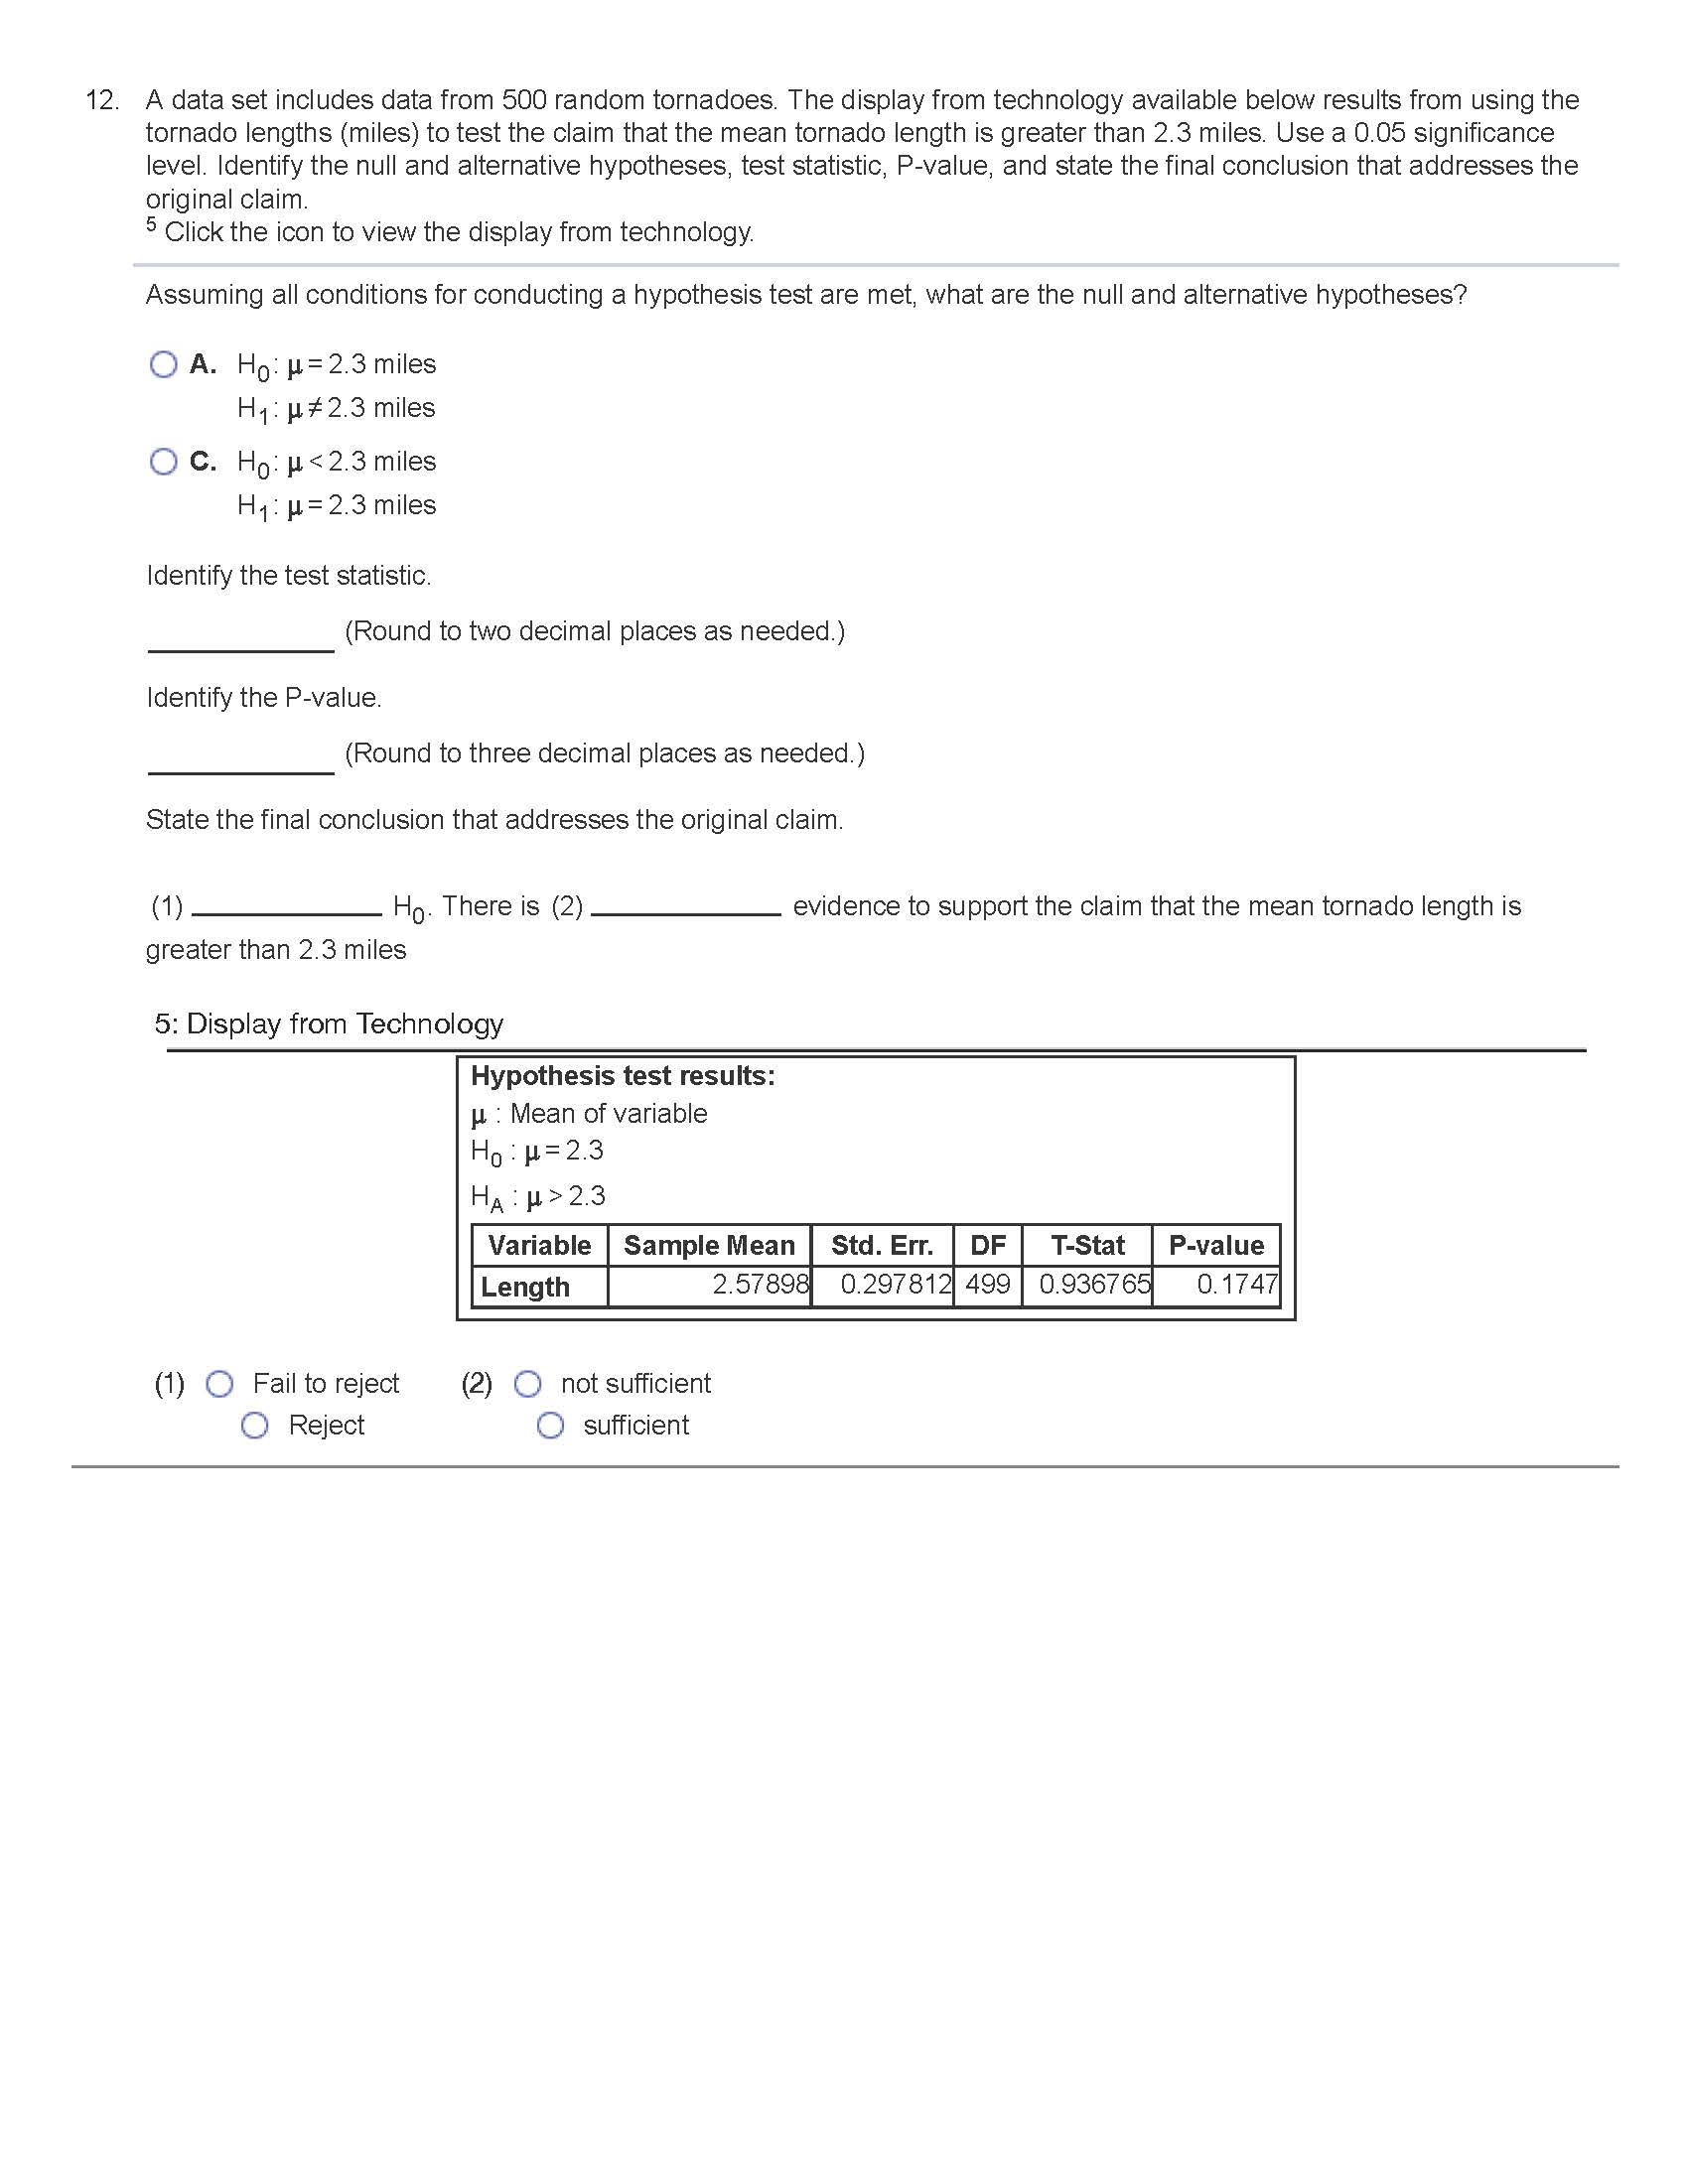
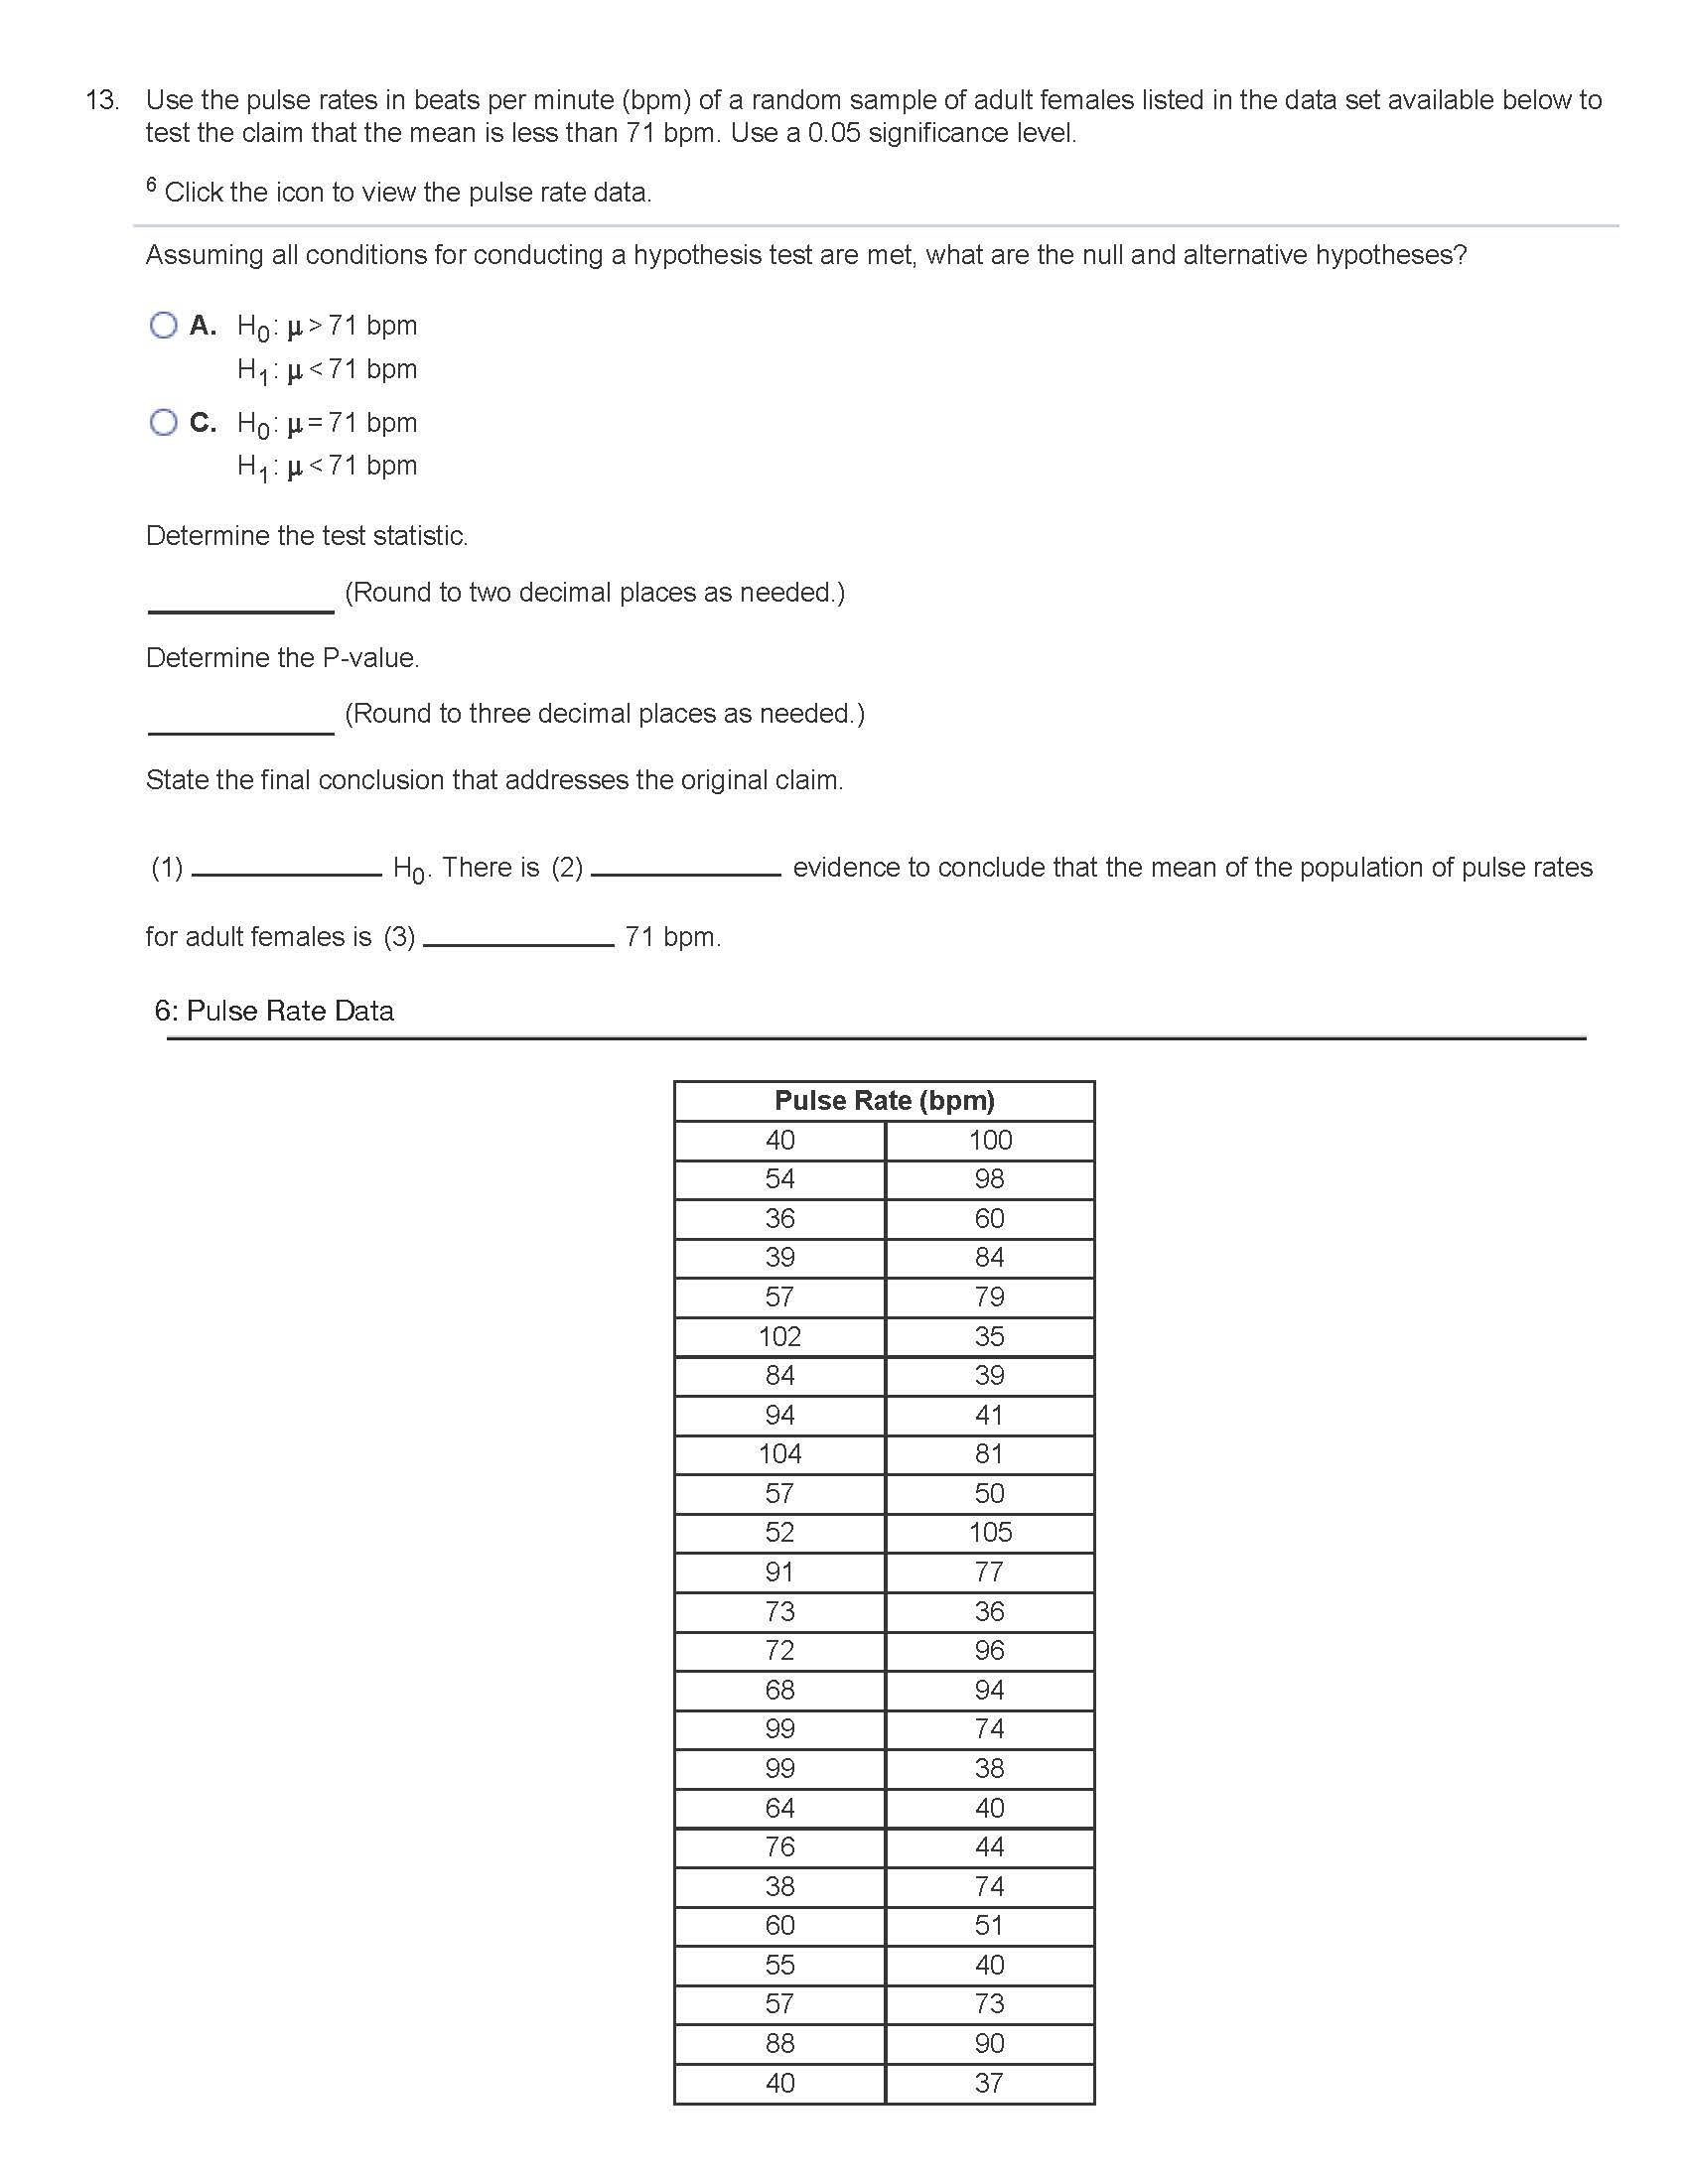
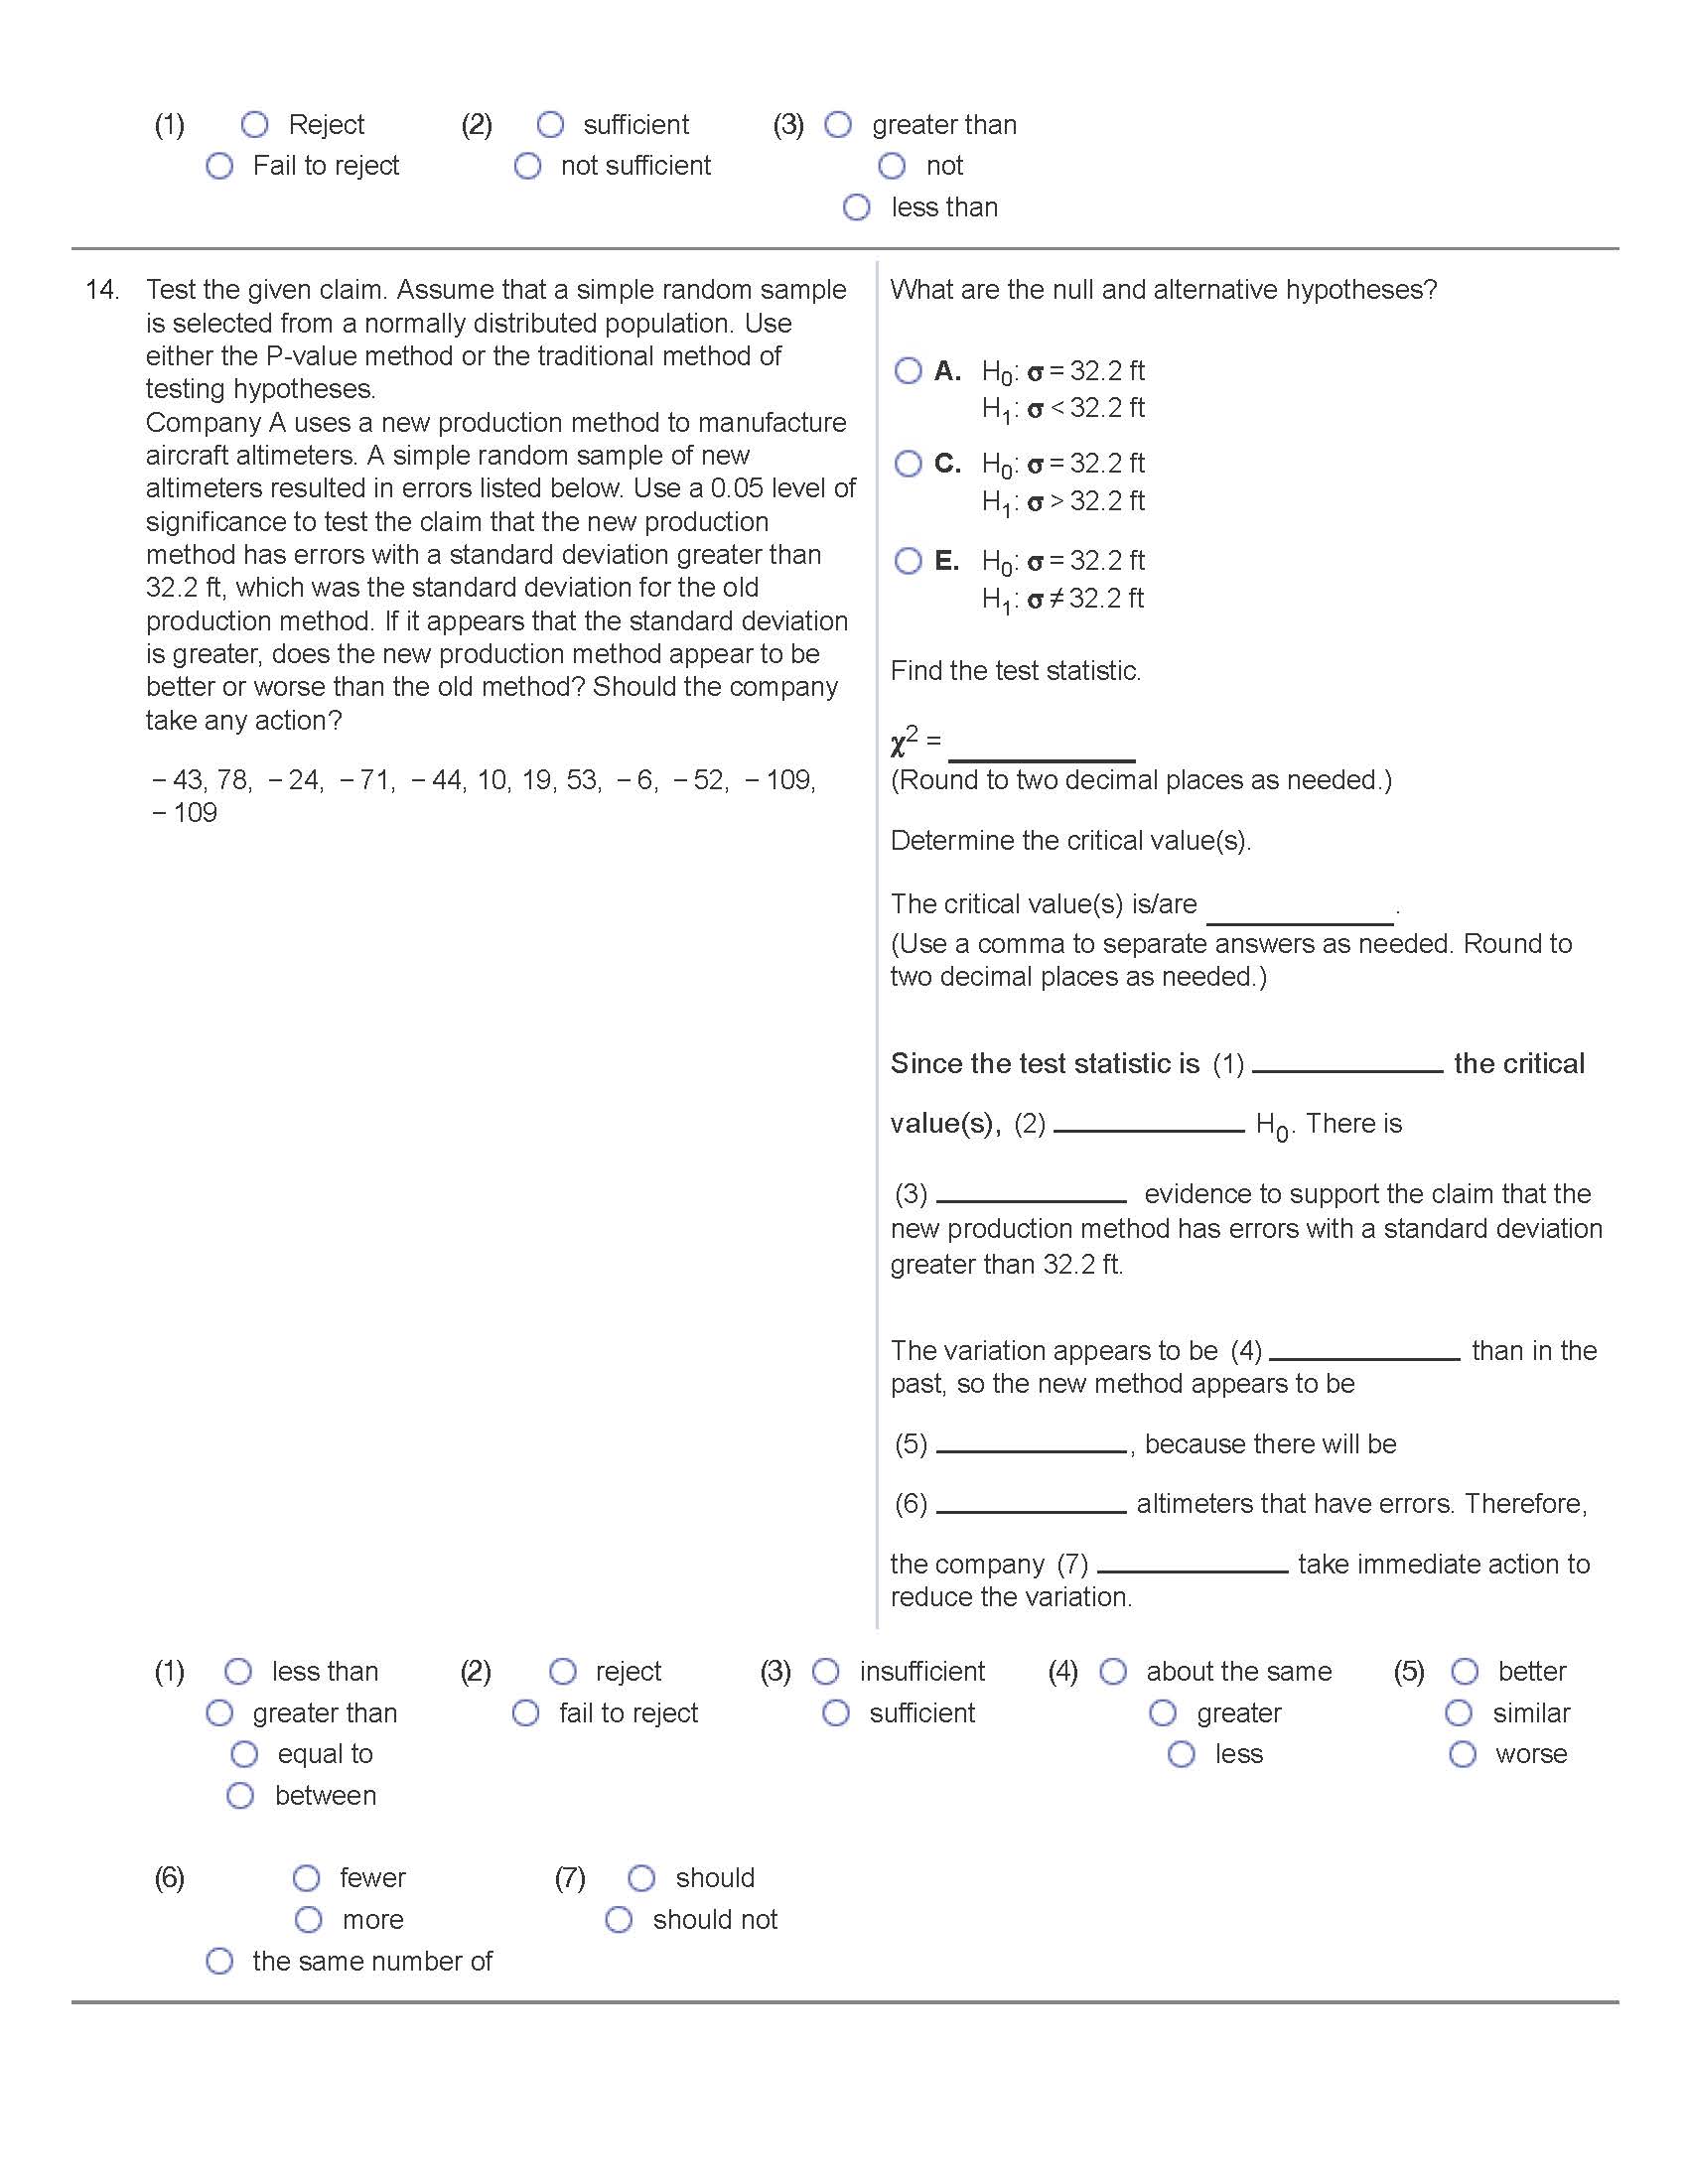
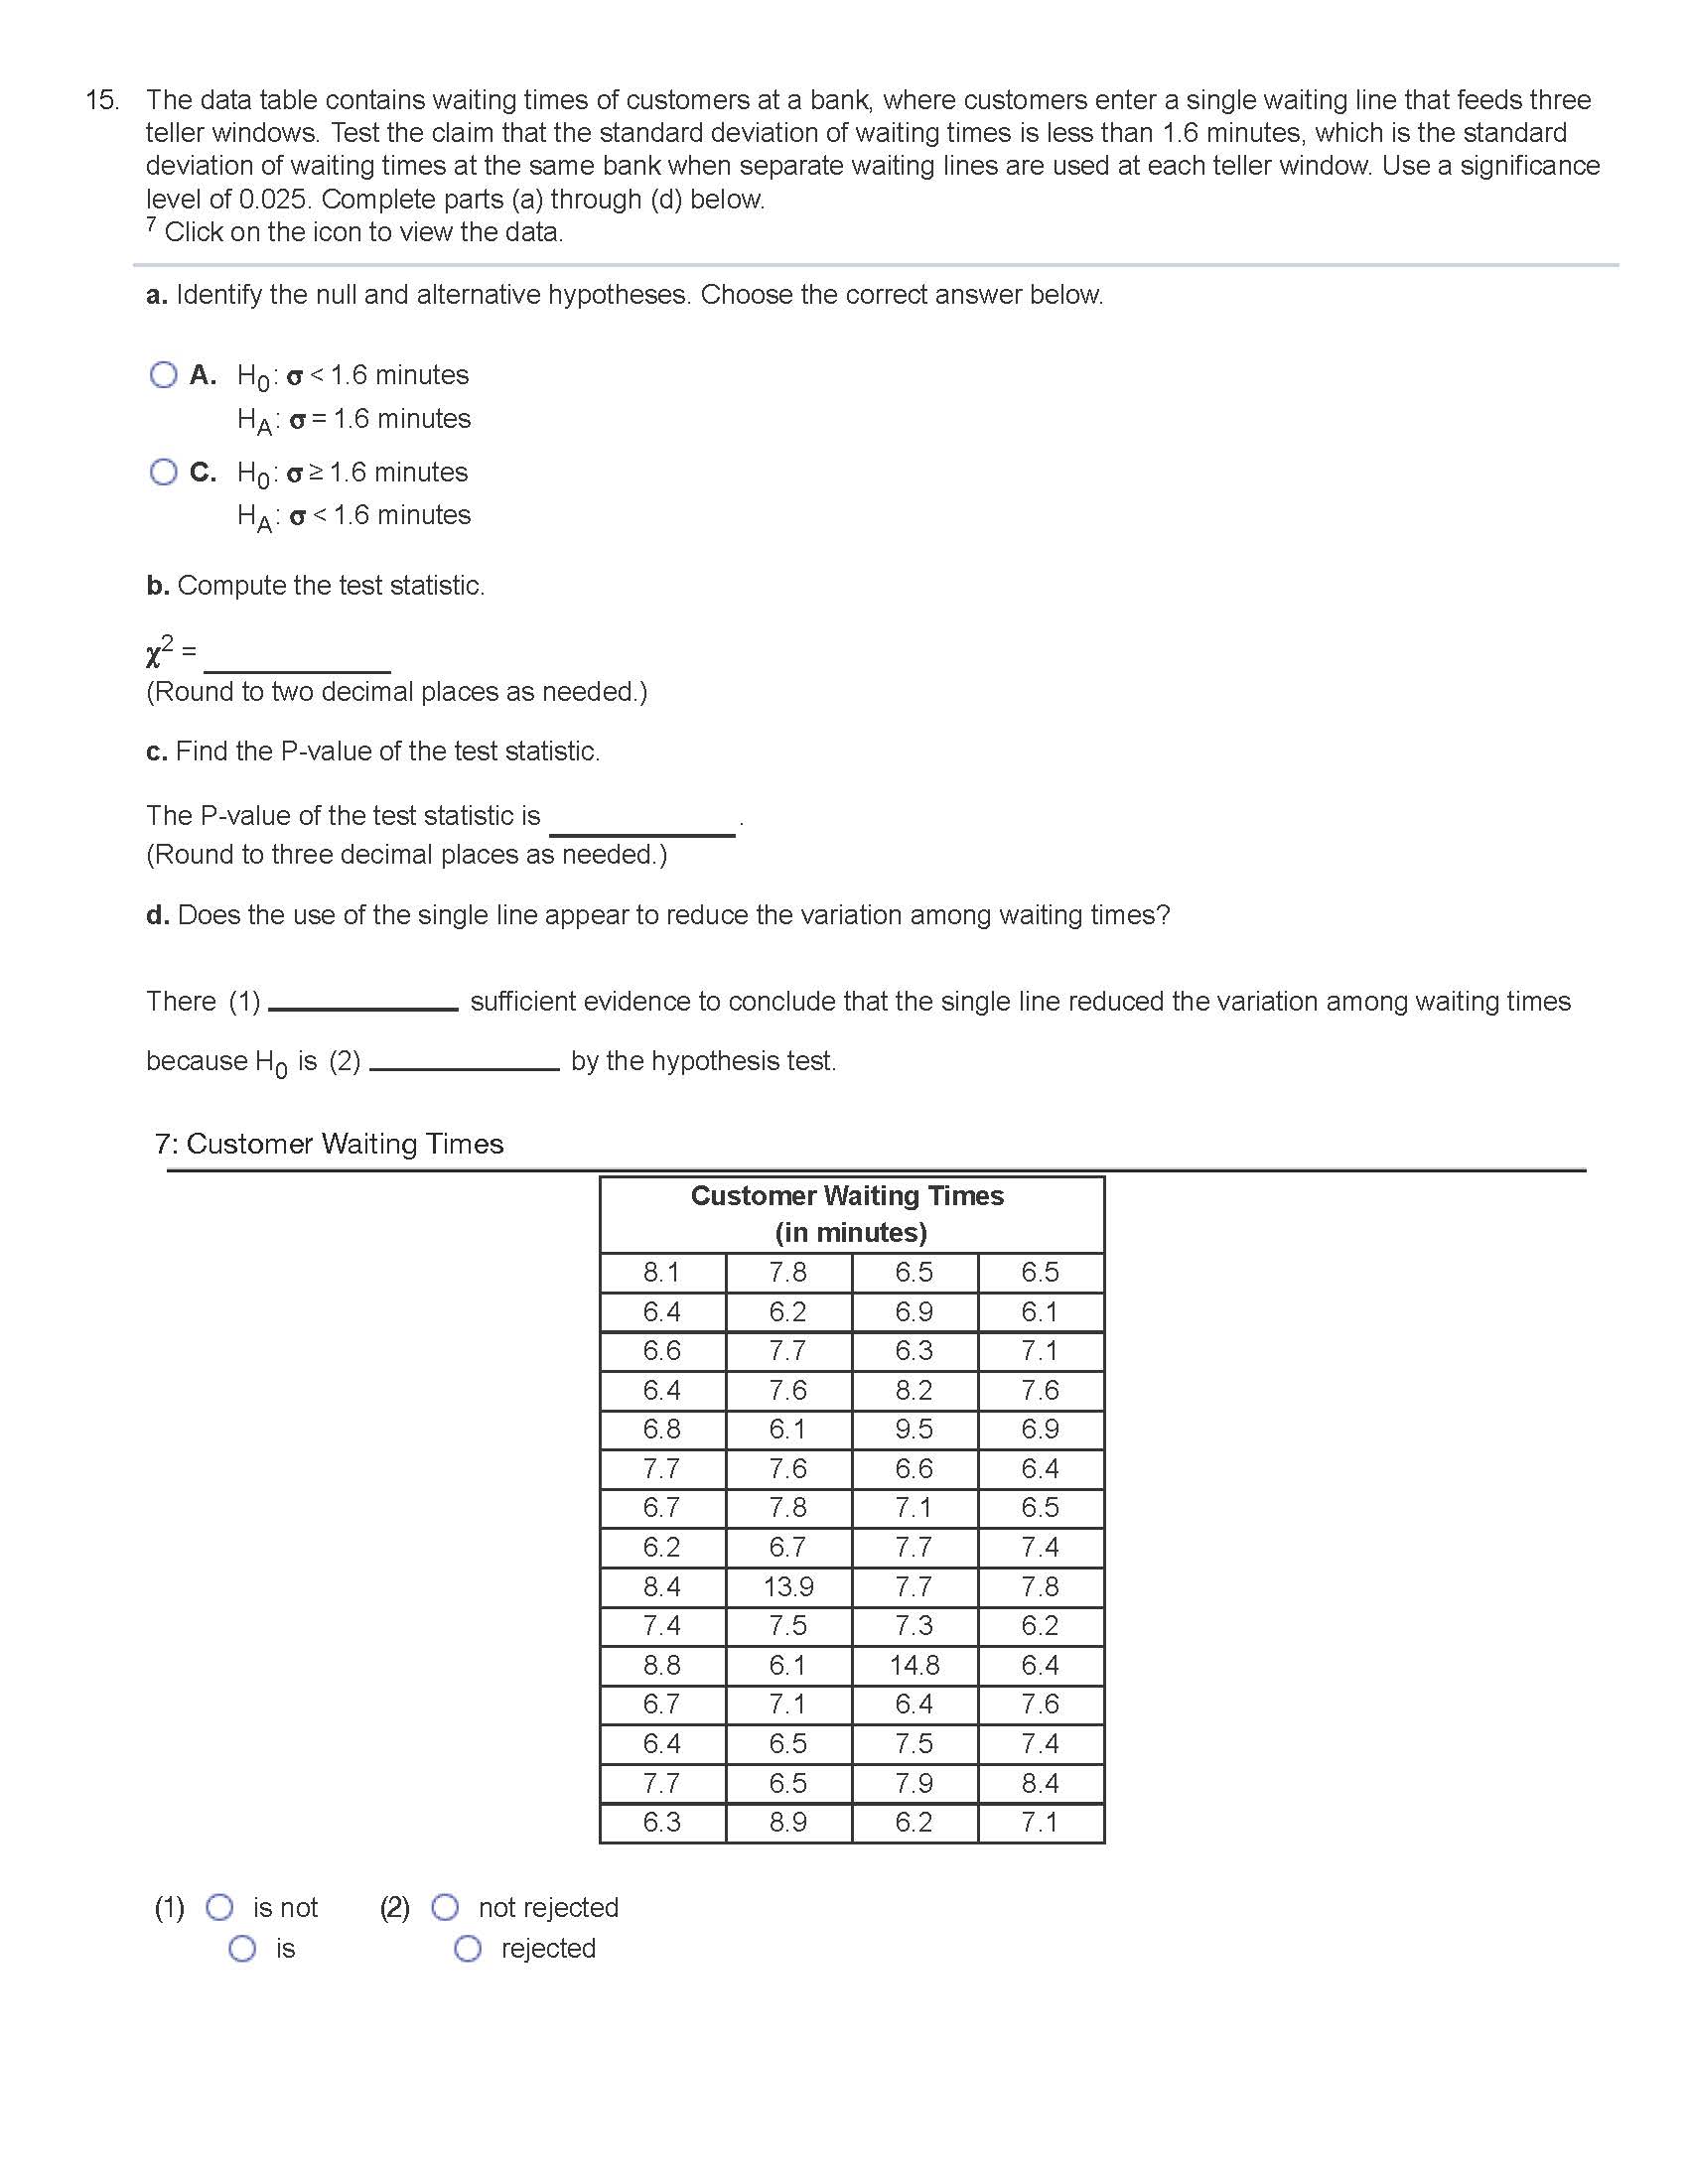
Claim: A majority of adults would erase all of their personal information online if they could. A software firm survey of 494 randomly selected adults showed that 64% of them would erase all of their personal information online if they could. Complete parts (a) and (b) below. a. Express the original claim in symbolic form. Let the parameter represent the adults that would erase their personal information. (1) (2) (Type an integer or a decimal. Do not round.) b. Identify the null and alternative hypotheses. H01 (3) (4) H11 (5) (6) (Type integers or decimals. Do not round.) (1)09 (2)0;E (3)011 (4)O> (5)06 (6)O> Oc O> OG O= Op O 0.3. a. Identify the hypothesis test as being two-tailed, left-tailed, or right-tailed. b. Find the P-value. c. Using a significance level of a= 0.05, should we reject Ho or should we fail to reject Ho? Click here to view page 1 of the standard normal distribution table. Click here to view page 2 of the standard normal distribution table. a. This is a (1)- _ test. b. P-value = (Round to three decimal places as needed.) c. Choose the correct conclusion below. O A. Reject Ho . There is sufficient evidence to support the claim that p > 0.3. O B. Fail to reject Ho. There is sufficient evidence to support the claim that p > 0.3. O C. Reject Ho . There is not sufficient evidence to support the claim that p > 0.3. O D. Fail to reject Ho. There is not sufficient evidence to support the claim that p > 0.3. 1: Standard Normal Distribution Table (Page 1) NEGATIVE z Scores 0 Standard Normal (z) Distribution: Cumulative Area from the LEFT Z .00 .02 .03 .04 .05 06 .07 .08 -3.50 and 0001 lower -3.4 1003 .0003 0003 0003 1003 0003 .0003 .0003 .0003 -3.3 0005 .0005 0005 0004 0004 .0004 0004 .0004 .0004 -3.2 0007 0007 .0006 .0006 0006 .0006 .0006 .0005 0005 -3. .0010 .0009 .0009 000 1008 .0008 .0008 .0008 .0007 -3.0 0013 0013 .0013 .0012 1012 0011 0011 .0011 .0010 -2.9 0019 101 8 1018 .0017 0016 0016 0015 0015 .0014 -2.8 1026 .0025 0024 0023 1023 0022 0021 0021 0020 -2.7 .0035 .0034 0033 .0032 1031 0030 .0029 .0028 .0027 -2.6 0047 .0045 1044 0043 0041 0040 0039 0038 0037 -2.5 0062 0060 0059 0057 0065 .0054 .0062 .0051 0049 -2.4 0082 0080 0078 0075 1073 0071 .0069 .0068 0066 -2.3 0107 0104 0102 0099 0096 .0094 .0091 0089 .0087 -2.2 .0139 .0136 0132 0129 0125 0122 .0119 0116 0113 -2.1 .0179 .0174 .0170 0166 .0162 .0158 .0154 .0150 0146 -2.0 0228 .0222 0217 0212 0207 0202 .0197 .0192 0188 -1.9 0287 .0281 0274 .0268 0262 .0256 0250 .0244 .0239 -1.8 0359 .0351 0344 0336 1329 .0322 .0314 0307 0301 -1.7 0446 0436 0427 .0418 0409 .0401 .0392 .0384 .0375 2/17-1.6 0548 .0537 0526 .0516 0505 .0495 0485 .0475 .0465 -1.5 0668 .0655 0643 0630 0618 0606 0594 0582 .0571 -1.4 0808 .0793 0778 0764 0749 0735 .0721 .0708 .0694 -1.3 .0968 .0951 .0934 .0918 0901 0885 .0869 .0853 .0838 -1.2 .1151 .1131 .1112 1093 .1075 1056 1038 .1020 .1003 -1.1 .1357 1335 .1314 1292 1271 .1251 1230 .1210 1190 -1.0 1587 1562 .1539 .1515 .1492 1469 1446 .1423 .1401 -0.9 .1841 .1814 788 1762 1736 .1711 .1685 .1660 .1635 -0.8 2119 2090 2061 2033 2005 1977 .1949 .1922 .1894 -0.7 2420 .2389 2358 2327 2296 .2266 .2236 .2206 2177 -0.6 2743 2709 2676 .2643 2611 2578 .2546 .2514 .2483 -0.5 .3085 .3050 .3015 .2981 2946 .2912 .2877 .2843 2810 -04 3446 3409 3372 3336 3300 3264 3228 3192 3156 -0.3 .3821 .3783 3745 3707 3669 .3632 .3594 .3557 3520 -0.2 4207 4168 4129 4090 4052 4013 3974 .3936 .3897 -0.1 4602 4562 4522 4483 4443 4404 .4364 .4325 4286 -0.0 .5000 4960 4920 4880 4840 .4801 4761 4721 .4681 Z 400 .01 .02 .03 .04 05 06 .07 08 Standard Normal (z) Distribution: Cumulative Area from the LEFT NOTE: For values of zbelow 3.49, use 0.0001 for the area. *Use these common values that result from inten z Score Area -1.645 0.0500 -2.575 0.0050 2: Standard Normal Distribution Table (Page 2) POSITIVE z Scores Standard Normal (z) Distribution: Cumulative Area from the LEFT Z .00 .01 .02 .03 .04 05 .06 .07 08 0.0 .5000 5040 5080 5120 .5160 5199 5239 5279 5319 0.1 .5398 .5438 5478 .5517 555 .5596 .5636 .5675 .5714 0.2 5793 .5832 5871 5910 .5948 .5987 .6026 .6064 .6103 0.3 6179 .6217 6255 6293 .6331 6368 .6406 6443 6480 0.4 6554 .6591 6628 1664 6700 .6736 6772 6808 6844 0.5 .6915 6950 6985 7019 .7054 7088 .7123 .7157 .7190 0.6 .7257 .7291 7324 7357 7389 7422 .7454 7486 7517 0.7 7580 .7611 7642 7673 7704 .7734 .7764 .7794 7823 0.8 .7881 .7910 7939 7967 .7995 8023 8051 8078 8106 0.9 8159 8186 3212 8238 .8264 .8289 .8315 .8340 8365 10 8413 8438 .8461 8485 8508 8531 8564 8577 8599 3/178790 .8643 .8665 .8686 8708 .8729 8749 .8770 8810 1.1 1.2 8849 8869 8888 8907 .8925 .8944 .8962 .8980 8997 1.3 .9032 9049 9066 9082 .9099 9115 .9131 .9147 9162 9222 236 .9251 .9265 .9279 9292 9306 1.4 9192 .9207 1.5 .9332 9345 .9357 9370 .9382 .9394 9406 9418 .9429 1.6 .9452 9474 9484 9495 .9505 9515 9525 9535 .9463 1.7 .9564 9564 9573 9582 .9591 9599 9608 .9616 9625 9641 .9649 9656 1664 9671 9678 9686 9693 9699 1.8 1.9 .9713 .9719 9726 9732 .9738 9744 9750 9756 9761 9778 9783 9788 9793 9798 9803 9808 9812 2.0 9772 2.1 .9821 9826 .9830 9834 .9838 .9842 .9846 .9850 9854 9887 2.2 .9861 .9864 9868 9871 9875 9878 .9881 9884 9913 2.3 .9893 9896 9898 9901 .9904 9906 .9909 .991 1 9932 9934 2.4 9918 9920 9922 9925 .9927 .9929 .9931 .9951 2.5 .9938 9940 .9941 9943 .9945 9946 .9948 .9949 .9953 9955 9956 9957 9959 .9960 .9961 9962 9963 2.6 9967 9968 .9969 9970 .9971 .9972 9973 2.7 .9965 9966 .9974 9975 9976 9977 9977 9978 9979 9979 9980 2.8 2.9 .9981 9982 3982 9983 .9984 9984 .9985 .9985 9986 9990 3.0 .9987 9987 9987 9988 .9988 .9989 9989 .9989 .9991 9991 .9992 .9992 .9992 .9992 9993 3.1 .9990 9991 9995 3.2 .9993 9993 9994 9994 .9994 .9994 9994 .9995 3.3 .9995 9995 9995 9996 .9996 9996 .9996 9996 9996 9997 9997 9997 9997 9997 9997 9997 .9997 9997 3.50. and up 9999 .00 01 .02 .03 .04 05 06 .07 08 Standard Normal (z) Distribution: Cumulative Area from the LEFT Common Cri NOTE: For values of zabove 3.49, use 0.9999 for the area. *Use these common values that result from interpolation: Confidence Level z Score Area 0.90 1.645 0.9500 0.96 2.575 0.9950 0.99 (1) O left-tailed O two-tailed O right-tailed5. The test statistic of z = - 1.83 is obtained when testing the claim that p 0.09 O C. H0: p0.1 Q C. H01p0.1 H1: p=0.1 O D. H0: p=0.1 H1 : p 0.508 O B. H0: p= 0.508 H11p0.8 OD. H0:p=0.8 H1zp23 \"mm ('1) O Fail to reject (2) 0 not sufficient 0 Reject 0 sufficient Use the pulse rates in beats per minute (bpm) of a random sample of adult females listed in the data set available below to test the claim that the mean is less than 71 bpm. Use a 0.05 significance level. 6 Clickthe icon to view the pulse rate data. Assuming all conditions for conducting a hypothesis test are met, what are the null and alternative hypotheses? QA. H02p>71bpm H1Zp 32 2ft significance to test the claim that the new production 1' ' method has errors with a standard deviation greater than 0 E. H0: 6 = 322 ft 32.2 ft, which was the standard deviation for the old H :6 322 ft production method. If it appears that the standard deviation 1 is greater, does the new production method appearto be . . . better or worse than the old method? Should the company End the test Stat'St'C' take any action? 2 x Z 43, 78, 24, 71, 44, 10, 19, 53, 6, 52, 109, (Round to two decimal places as needed.) 109 Determine the critical value(s). The critical value(s) is/are . (Use a comma to separate answers as needed. Round to two decimal places as needed.) Since the test statistic is (1) the critical value(s), (2) H0. There is (3) evidence to support the claim that the new production method has errors with a standard deviation greater than 32.2 ft. The variation appears to be (4) than in the past, so the new method appears to be (5) , because there will be (6) altimeters that have errors. Therefore, the company (7) take immediate action to reduce the variation. (1) 0 less than (2) O reject (3) O insufficient (4) O about the same (5) 0 better 0 greater than Ci fail to reject O sufficient O greater C) similar 0 equal to 0 less 0 worse O between (6) O fewer U) 0 should 0 more O should not Q the same number of 15. The data table contains waiting times of customers at a bank, where customers enter a single waiting line that feeds three teller windows. Test the claim that the standard deviation of waiting times is less than 1.6 minutes, which is the standard deviation of waiting times at the same bank when separate waiting lines are used at each teller window. Use a significance level of 0.025. Complete parts (a) through (d) below. 7 Click on the icon to view the data. 2. Identify the null and alternative hypotheses. Choose the correct answer below. Q A. H020
Step by Step Solution
There are 3 Steps involved in it

Get step-by-step solutions from verified subject matter experts


