I'm needing some help with these two different questions
Question 1
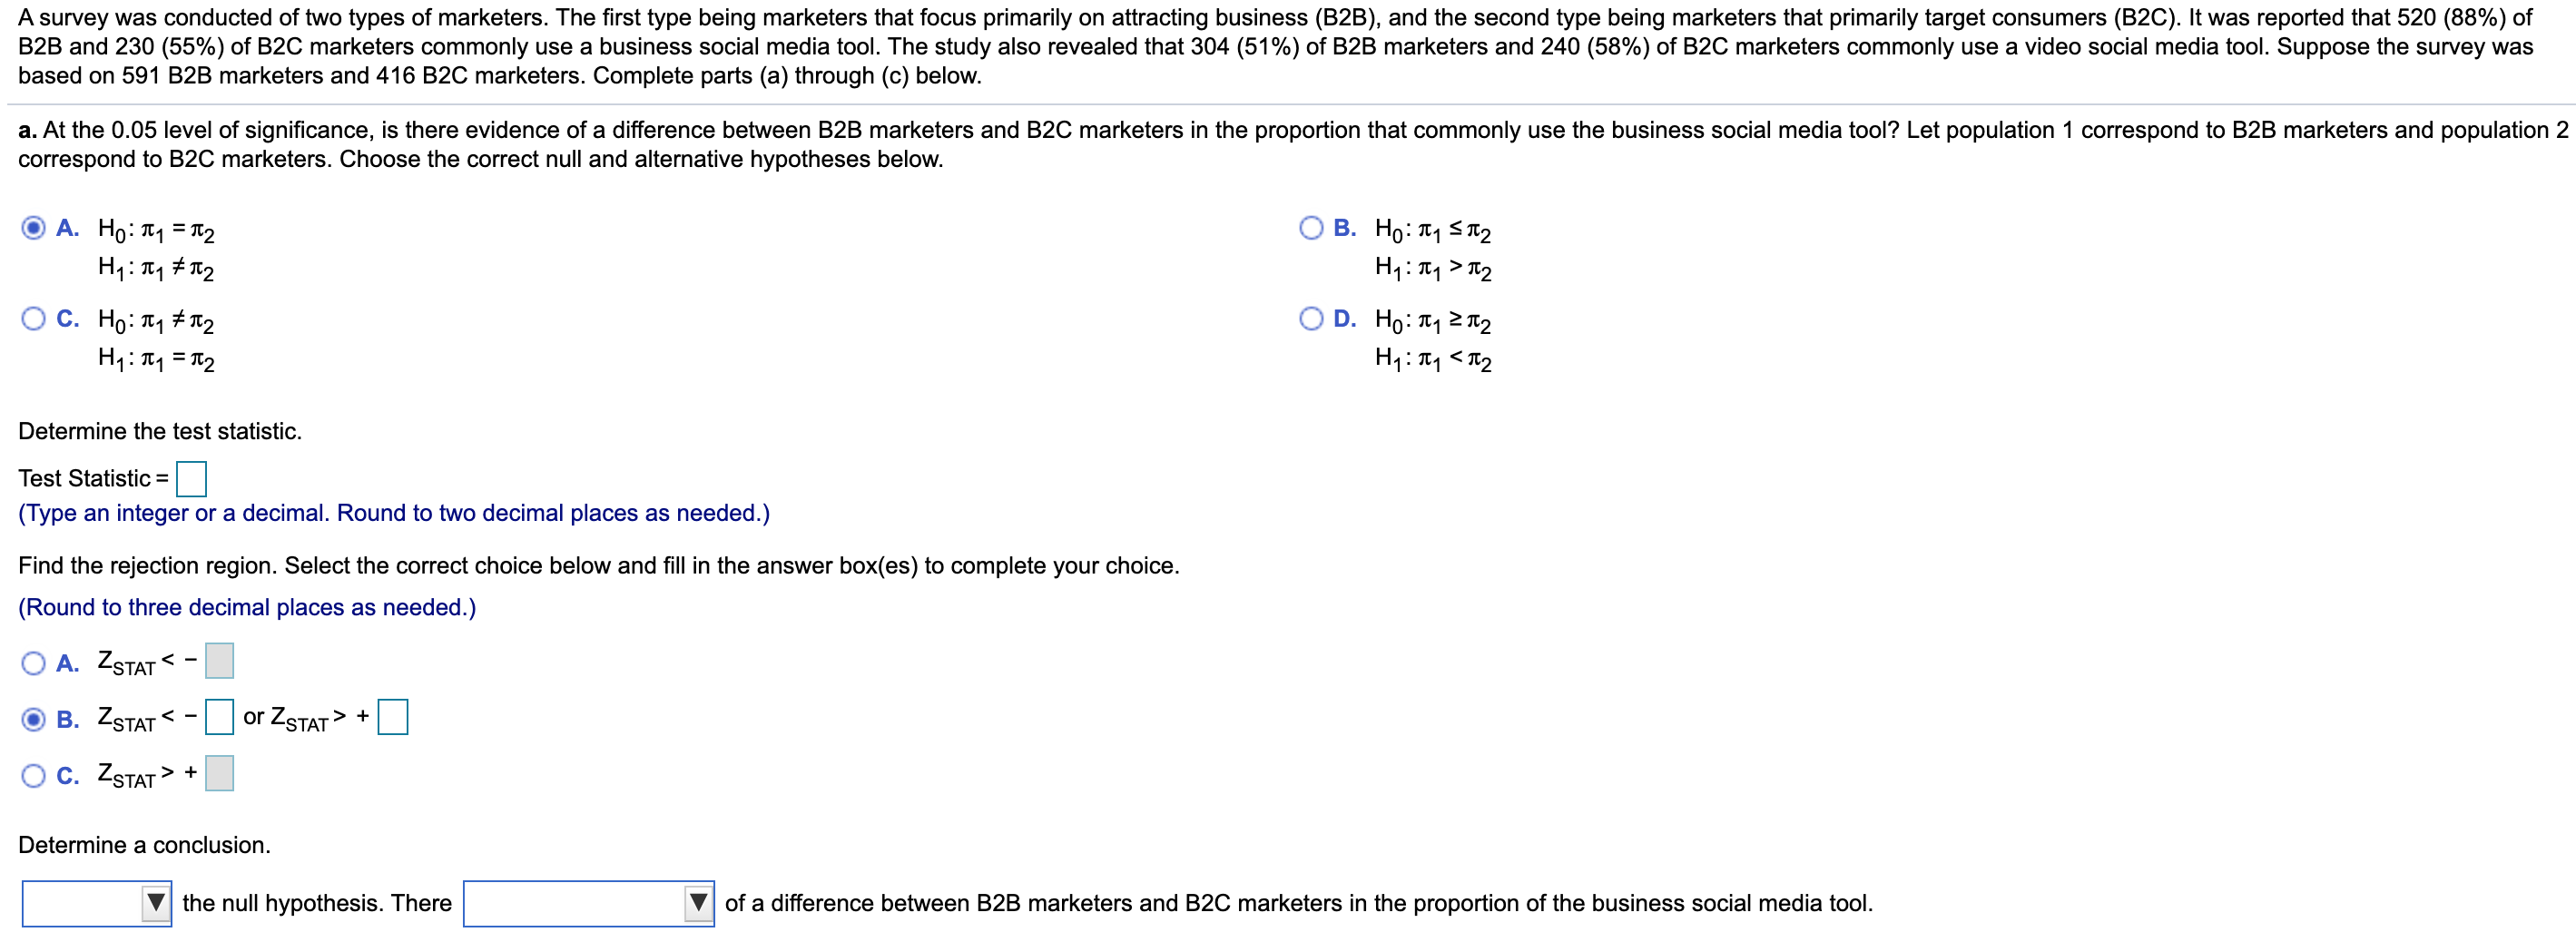
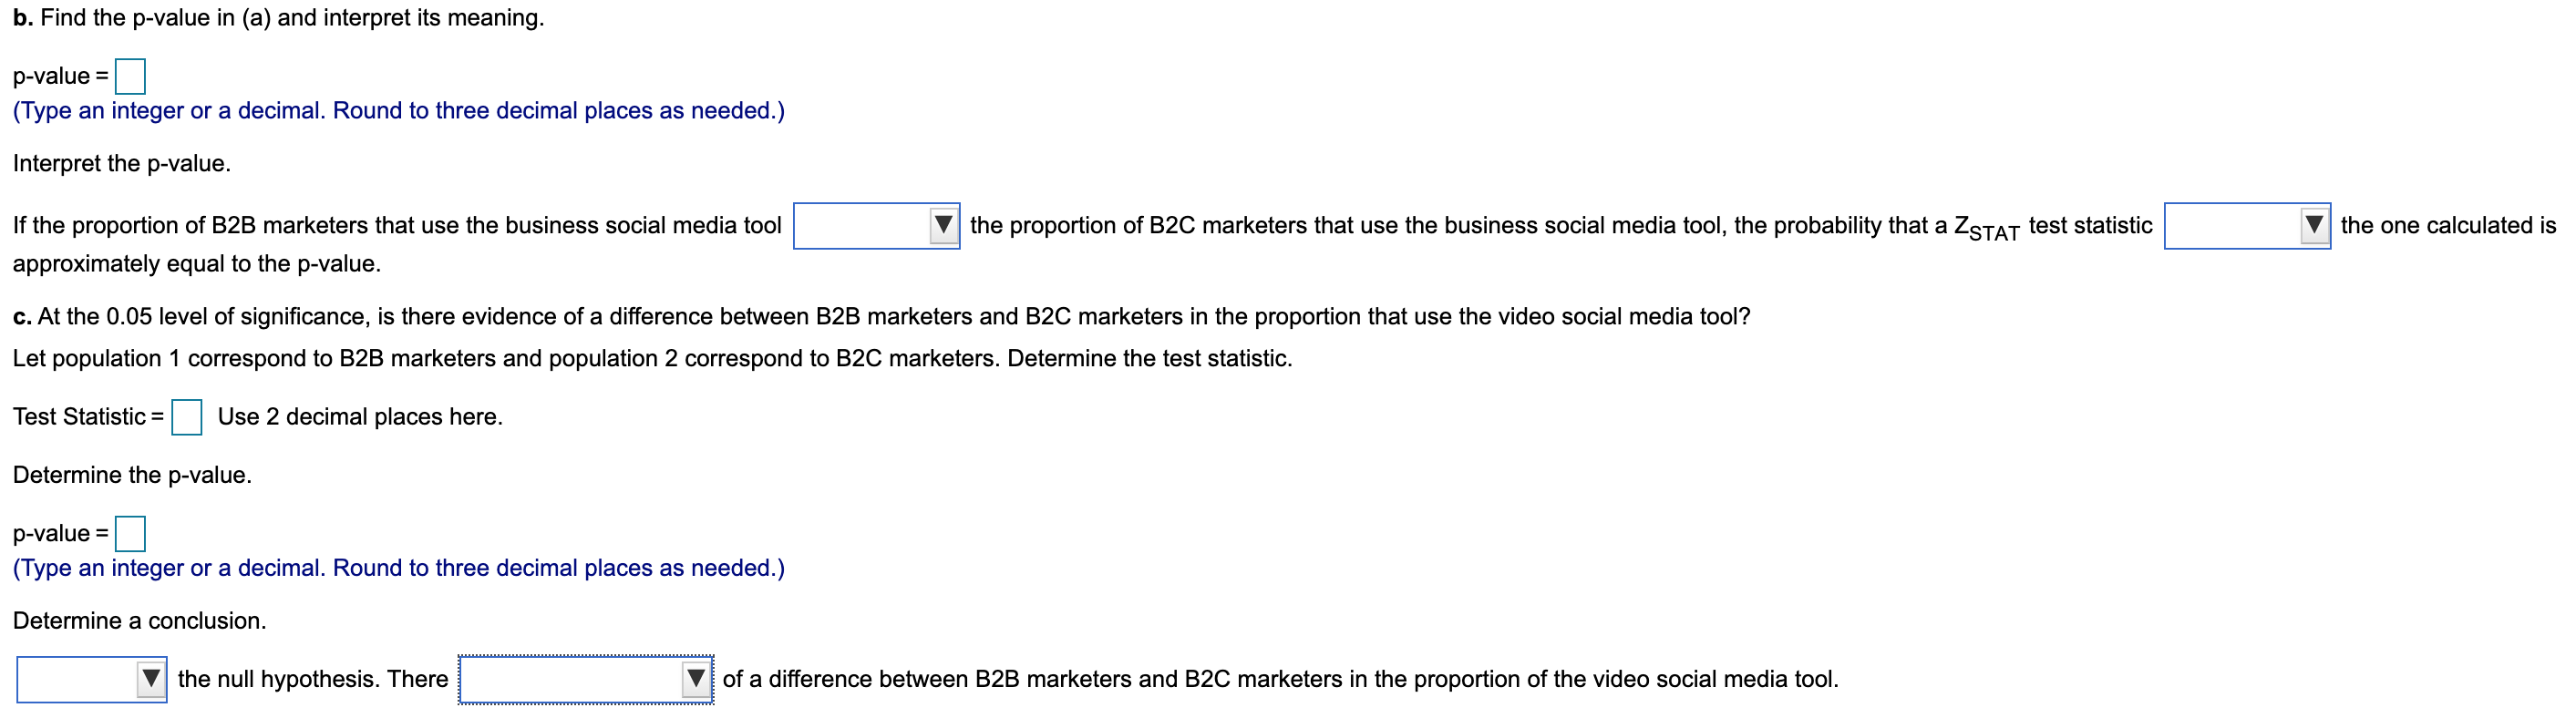
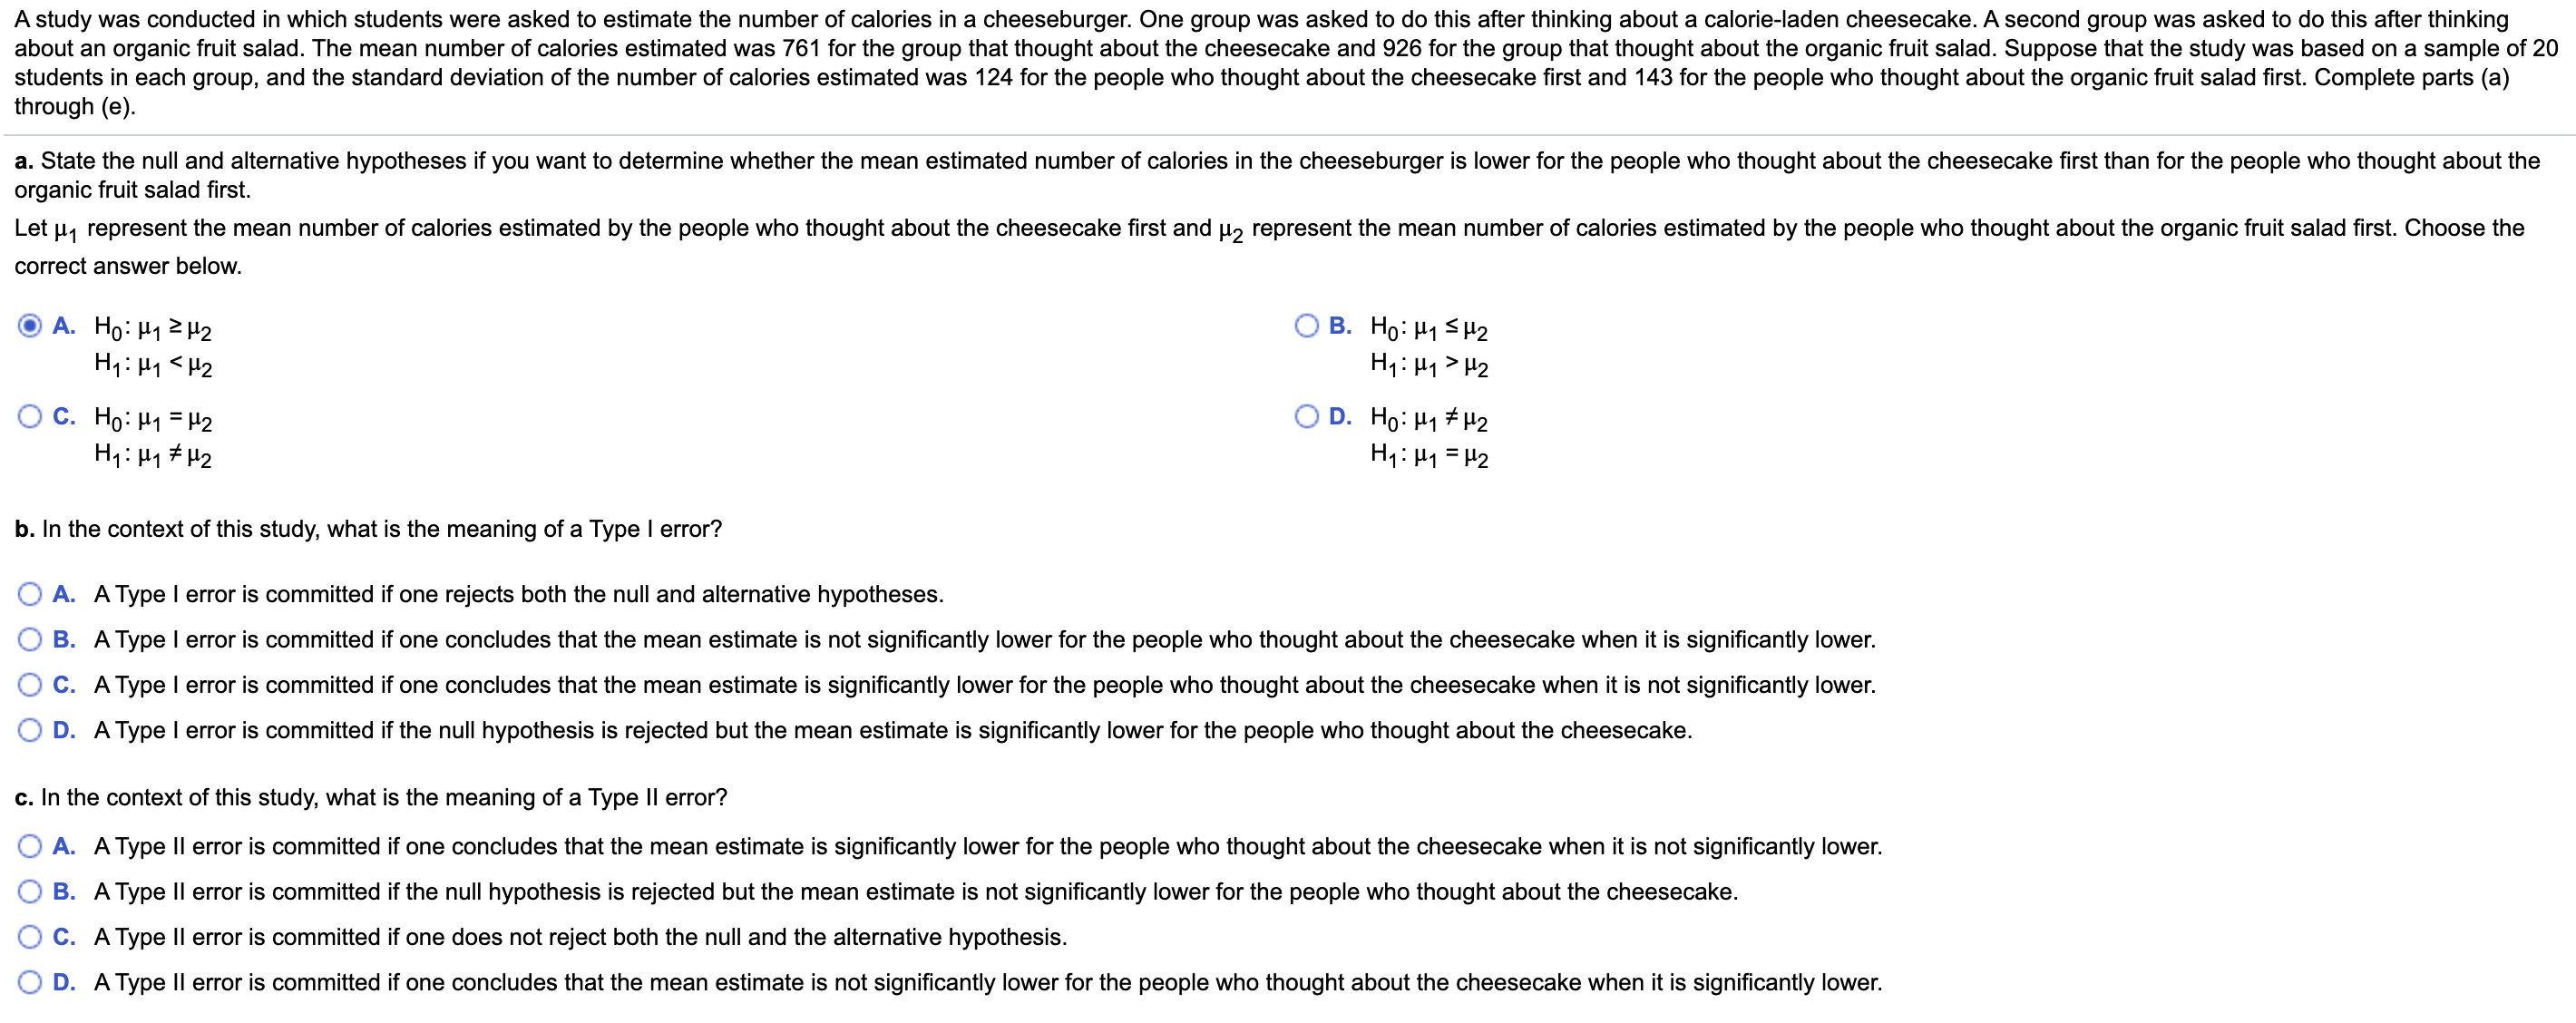
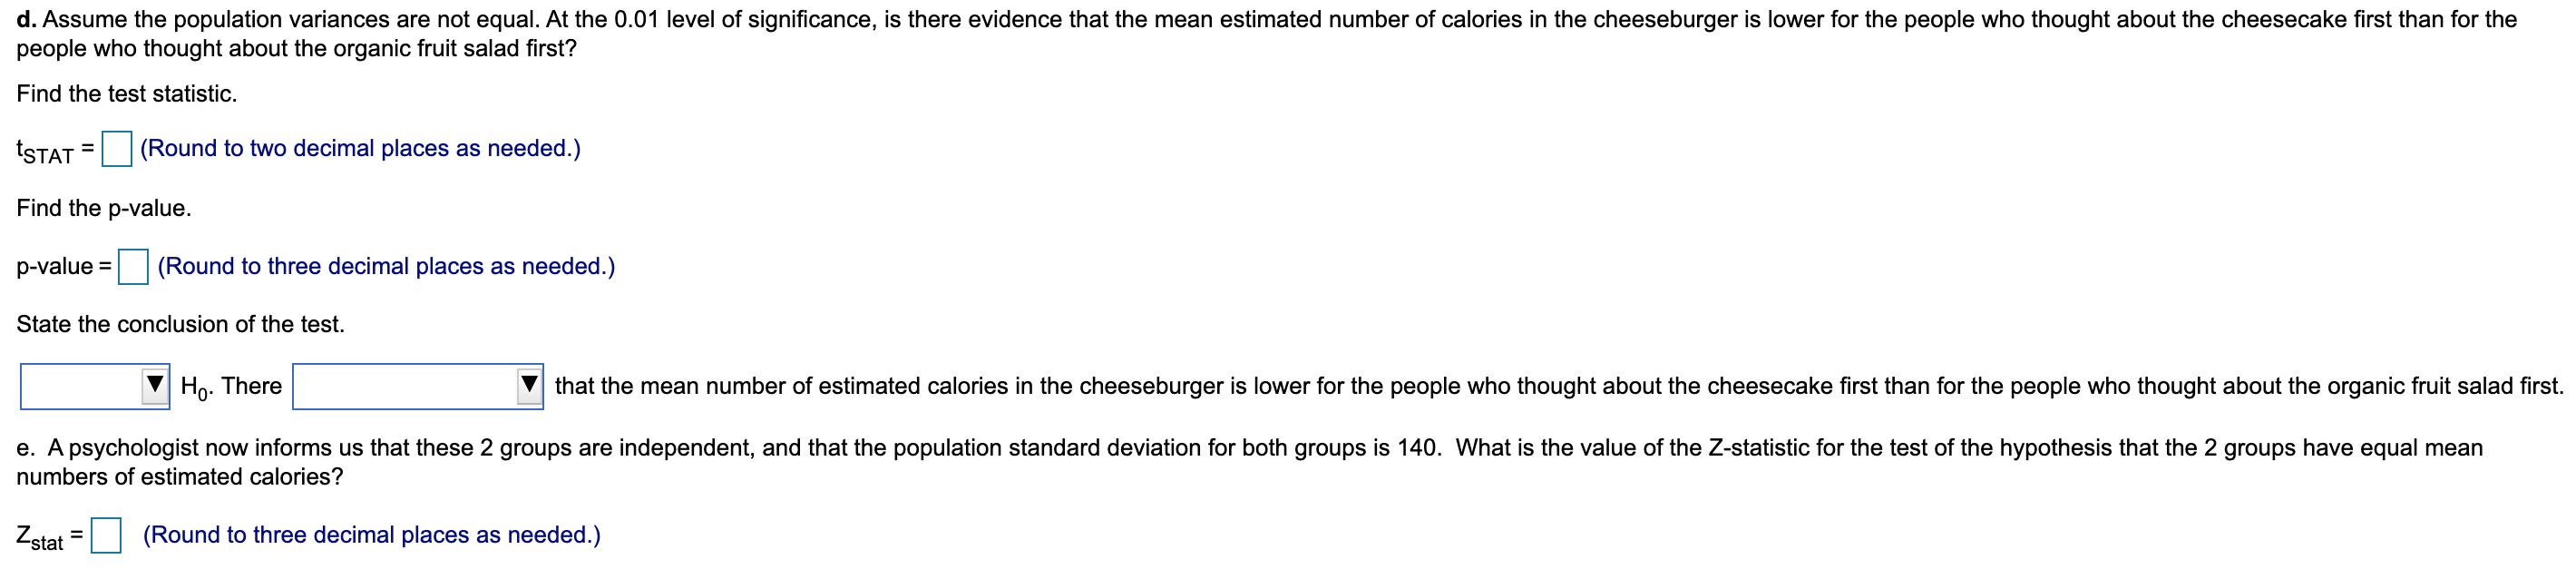
A survey was conducted of two types of marketers. The first type being marketers that focus primarily on attracting business (B2B), and the second type being marketers that primarily target consumers (B2C). It was reported that 520 (88%) of B2B and 230 (55%) of B2C marketers commonly use a business social media tool. The study also revealed that 304 (51%) of B2B marketers and 240 (58%) of B2C marketers commonly use a video social media tool. Suppose the survey was based on 591 B2B marketers and 416 B2C marketers. Complete parts (a) through (c) below. a. At the 0.05 level of significance, is there evidence of a difference between B2B marketers and B2C marketers in the proportion that commonly use the business social media tool? Let population 1 correspond to B2B marketers and population 2 correspond to B2C marketers. Choose the correct null and alternative hypotheses below. O A. HO: T1 = 12 OB. HO: T1 ST2 H1 : 101 # 1 2 H 1 : 1 1 > I 2 O C. HO: my # 12 OD. HO: T1 2 12 H1 : 101 = 1 2 H1 : 101 + O C. ZSTAT > + Determine a conclusion. the null hypothesis. There of a difference between B2B marketers and B2C marketers in the proportion of the business social media tool.b. Find the p-value in (a) and interpret its meaning. p-value = (Type an integer or a decimal. Round to three decimal places as needed.) Interpret the p-value. If the proportion of B2B marketers that use the business social media tool the proportion of B2C marketers that use the business social media tool, the probability that a ZSTAT test statistic the one calculated is approximately equal to the p-value. c. At the 0.05 level of significance, is there evidence of a difference between B2B marketers and B2C marketers in the proportion that use the video social media tool? Let population 1 correspond to B2B marketers and population 2 correspond to B2C marketers. Determine the test statistic. Test Statistic = Use 2 decimal places here. Determine the p-value. p-value = (Type an integer or a decimal. Round to three decimal places as needed.) Determine a conclusion. the null hypothesis. There of a difference between B2B marketers and B2C marketers in the proportion of the video social media tool.A study was conducted in which students were asked to estimate the number of calories in a cheeseburger. One group was asked to do this after thinking about a calorie-laden cheesecake. A second group was asked to do this after thinking about an organic fruit salad. The mean number of calories estimated was 761 for the group that thought about the cheesecake and 926 for the group that thought about the organic fruit salad. Suppose that the study was based on a sample of 20 students in each group, and the standard deviation of the number of calories estimated was 124 for the people who thought about the cheesecake first and 143 for the people who thought about the organic fruit salad first. Complete parts (a) through (e). a. State the null and alternative hypotheses if you want to determine whether the mean estimated number of calories in the cheeseburger is lower for the people who thought about the cheesecake first than for the people who thought about the organic fruit salad first. Let jy represent the mean number of calories estimated by the people who thought about the cheesecake first and J2 represent the mean number of calories estimated by the people who thought about the organic fruit salad first. Choose the correct answer below. OA. HO: H1 2 H2 OB. HO: MISH2 H1: My H2 O C. HO: H1 = H2 OD. HO: M1 # H2 H1: My # H2 H1: H1 = H2 b. In the context of this study, what is the meaning of a Type I error? O A. A Type I error is committed if one rejects both the null and alternative hypotheses. O B. A Type I error is committed if one concludes that the mean estimate is not significantly lower for the people who thought about the cheesecake when it is significantly lower. O C. A Type I error is committed if one concludes that the mean estimate is significantly lower for the people who thought about the cheesecake when it is not significantly lower. O D. A Type I error is committed if the null hypothesis is rejected but the mean estimate is significantly lower for the people who thought about the cheesecake. c. In the context of this study, what is the meaning of a Type II error? O A. A Type ll error is committed if one concludes that the mean estimate is significantly lower for the people who thought about the cheesecake when it is not significantly lower. O B. A Type II error is committed if the null hypothesis is rejected but the mean estimate is not significantly lower for the people who thought about the cheesecake. O C. A Type II error is committed if one does not reject both the null and the alternative hypothesis. O D. A Type II error is committed if one concludes that the mean estimate is not significantly lower for the people who thought about the cheesecake when it is significantly lower.d. Assume the population variances are not equal. At the 0.01 level of significance, is there evidence that the mean estimated number of calories in the cheeseburger is lower for the people who thought about the cheesecake first than for the people who thought about the organic fruit salad first? Find the test statistic. tSTAT =(Round to two decimal places as needed.) Find the p-value. p-value = (Round to three decimal places as needed.) State the conclusion of the test. Ho. There that the mean number of estimated calories in the cheeseburger is lower for the people who thought about the cheesecake first than for the people who thought about the organic fruit salad first. e. A psychologist now informs us that these 2 groups are independent, and that the population standard deviation for both groups is 140. What is the value of the Z-statistic for the test of the hypothesis that the 2 groups have equal mean numbers of estimated calories? Zstat = (Round to three decimal places as needed.)