

Answered step by step
Verified Expert Solution
Question
1 Approved Answer
I'm so confused on this question Task Print Analyzing Univariate Data In this activity, you will compare the mean, median, interquartile range, and standard deviation
I'm so confused on this question
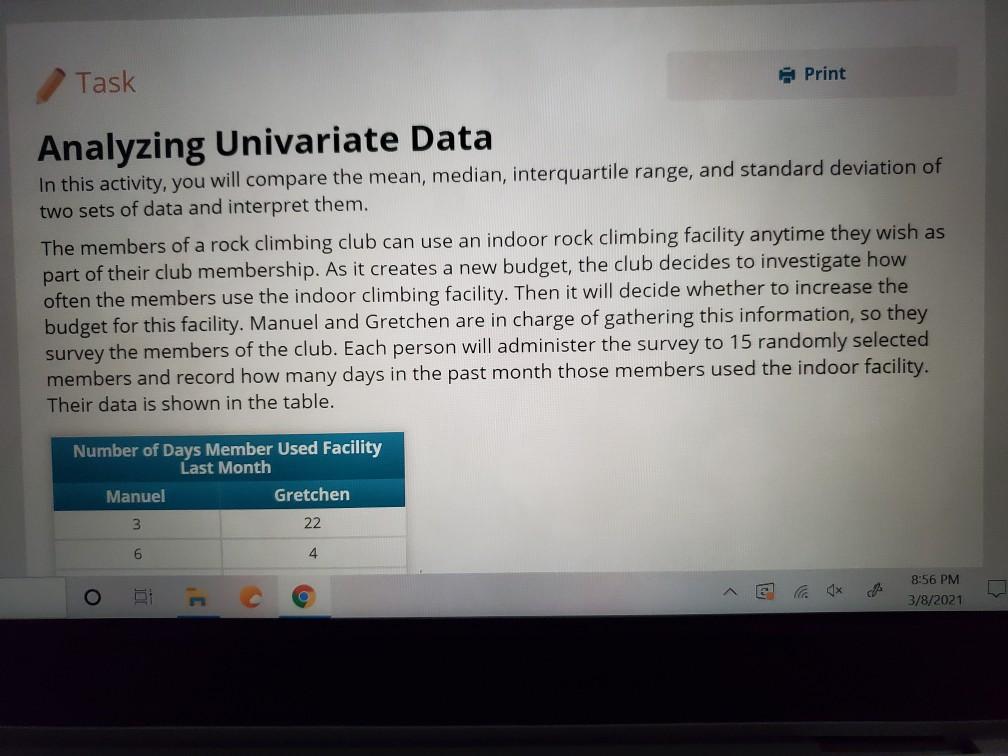
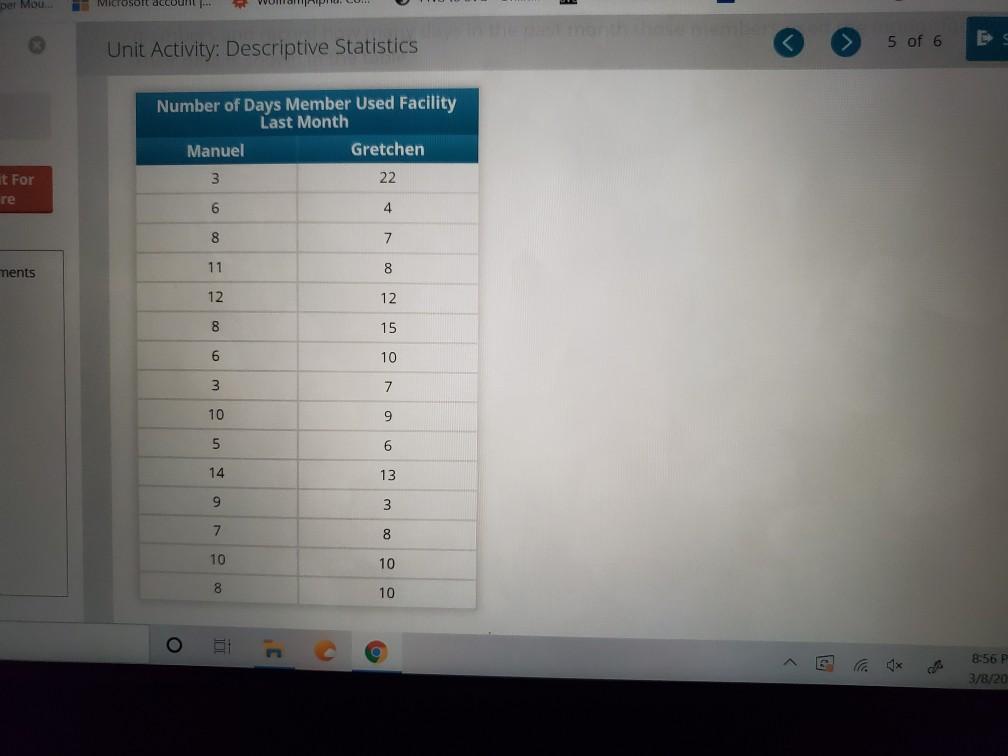
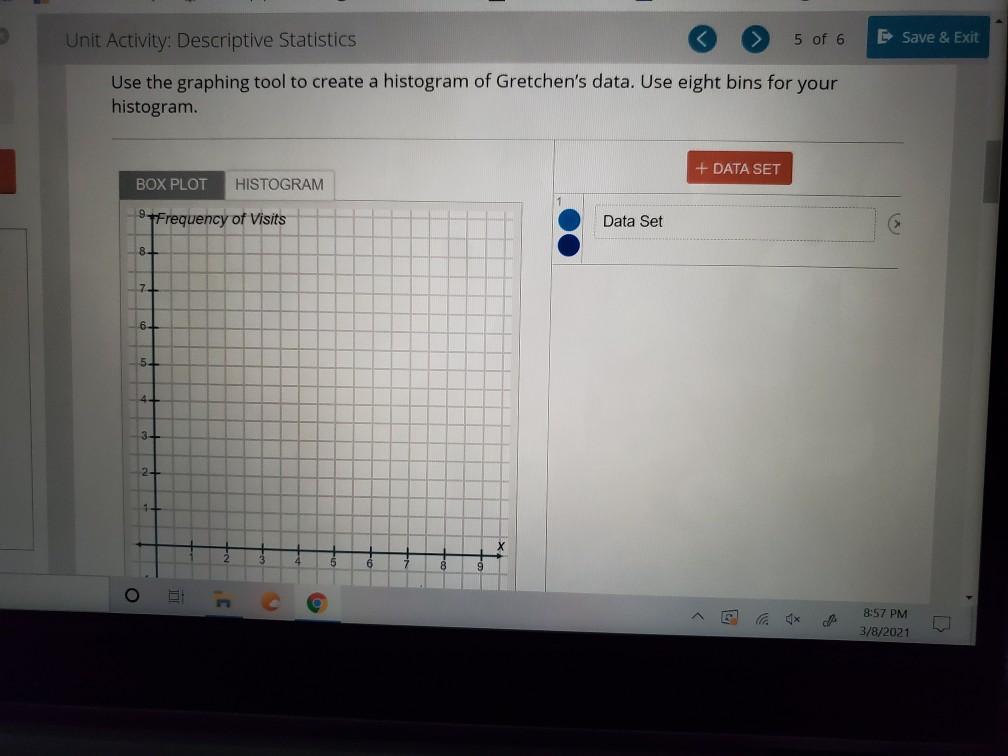
Task Print Analyzing Univariate Data In this activity, you will compare the mean, median, interquartile range, and standard deviation of two sets of data and interpret them. The members of a rock climbing club can use an indoor rock climbing facility anytime they wish as part of their club membership. As it creates a new budget, the club decides to investigate how often the members use the indoor climbing facility. Then it will decide whether to increase the budget for this facility. Manuel and Gretchen are in charge of gathering this information, so they survey the members of the club. Each person will administer the survey to 15 randomly selected members and record how many days in the past month those members used the indoor facility. Their data is shown in the table. Number of Days Member Used Facility Last Month Manuel Gretchen 22 6 4 o 8:56 PM 3/8/2021 Der Mou Microsoft account 5 of 6 D Unit Activity: Descriptive Statistics Number of Days Member Used Facility Last Month Manuel Gretchen 3 22 t For re 6 4 8 7 ments 11 8 12 12 8 15 6 10 3 7 10 9 5 6 14 13 9 3 7. 8 10 10 8 10 8:56 P 3/8/20 Unit Activity: Descriptive Statistics 5 of 6 E Save & Exit Use the graphing tool to create a histogram of Gretchen's data. Use eight bins for your histogram. + DATA SET BOX PLOT HISTOGRAM 9 Frequency of Visits Data Set 8 7 5. O 8:57 PM 3/8/2021 Task Print Analyzing Univariate Data In this activity, you will compare the mean, median, interquartile range, and standard deviation of two sets of data and interpret them. The members of a rock climbing club can use an indoor rock climbing facility anytime they wish as part of their club membership. As it creates a new budget, the club decides to investigate how often the members use the indoor climbing facility. Then it will decide whether to increase the budget for this facility. Manuel and Gretchen are in charge of gathering this information, so they survey the members of the club. Each person will administer the survey to 15 randomly selected members and record how many days in the past month those members used the indoor facility. Their data is shown in the table. Number of Days Member Used Facility Last Month Manuel Gretchen 22 6 4 o 8:56 PM 3/8/2021 Der Mou Microsoft account 5 of 6 D Unit Activity: Descriptive Statistics Number of Days Member Used Facility Last Month Manuel Gretchen 3 22 t For re 6 4 8 7 ments 11 8 12 12 8 15 6 10 3 7 10 9 5 6 14 13 9 3 7. 8 10 10 8 10 8:56 P 3/8/20 Unit Activity: Descriptive Statistics 5 of 6 E Save & Exit Use the graphing tool to create a histogram of Gretchen's data. Use eight bins for your histogram. + DATA SET BOX PLOT HISTOGRAM 9 Frequency of Visits Data Set 8 7 5. O 8:57 PM 3/8/2021Step by Step Solution
There are 3 Steps involved in it
Step: 1

Get Instant Access to Expert-Tailored Solutions
See step-by-step solutions with expert insights and AI powered tools for academic success
Step: 2

Step: 3
Ace Your Homework with AI
Get the answers you need in no time with our AI-driven, step-by-step assistance
Get Started
Guide To Investing In Rental Properties
Authors: Dennis Mulongo
1st Edition
979-8424909191