 I'm stuck and need help with getting the quick ratio and net profit margin based on the financial report I have for a company for the year 2018. Here I attach the numbers you may need please let me know how you got it and if you need any other info. Thanks.
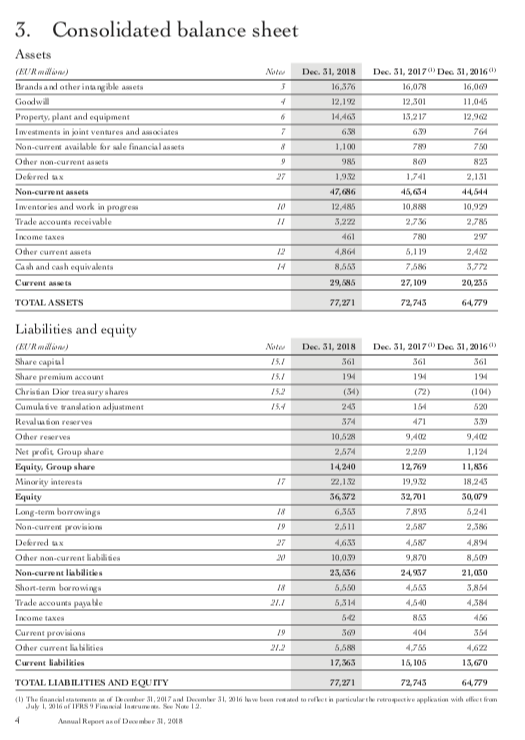
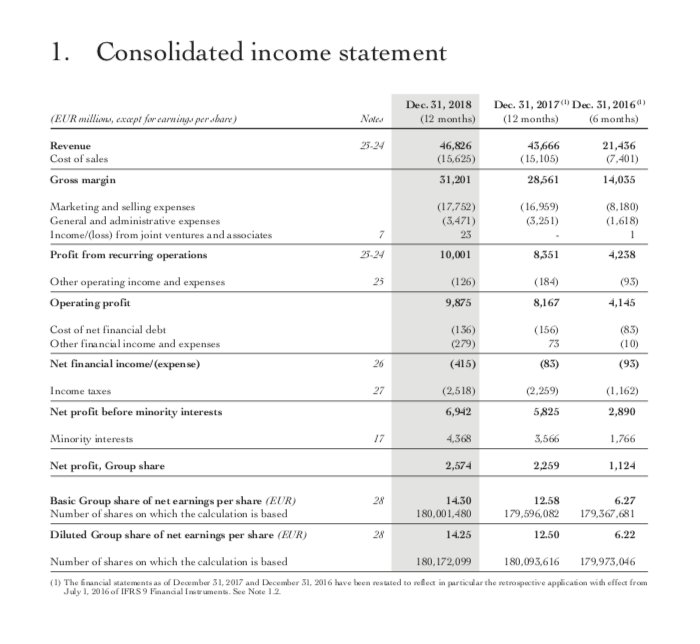
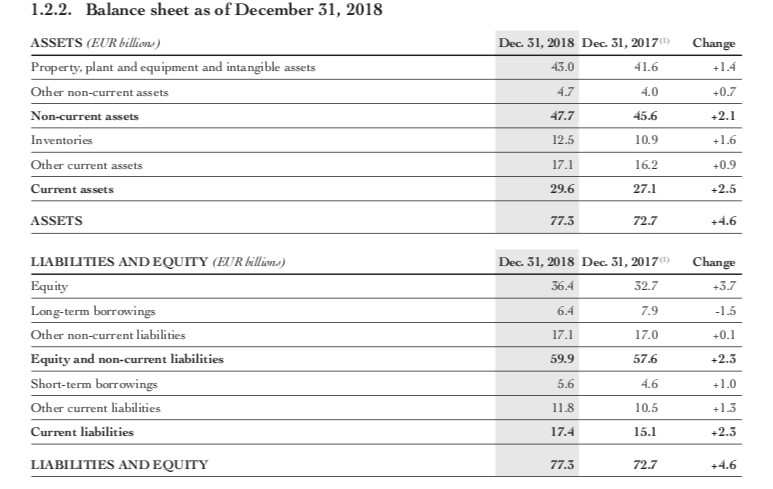
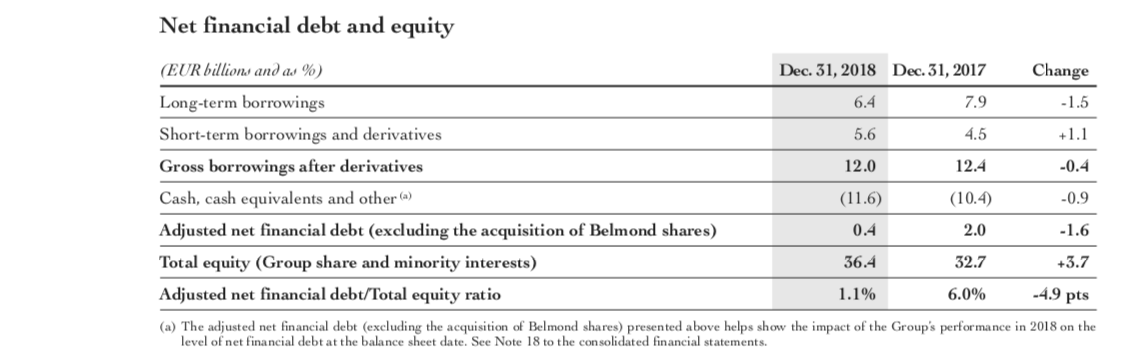
3. Consolidated balance sheet Assets Dec 31, 2018 Dec 31, 2017 Dec 31, 2016 16576 16.07 16.00 Gwa 12.192 20111045 1440 15217 123 Property plant and equipment Iements in Sint ventures and associates Non creavilable for le financuas 1.100 Other curatat ONS D. 1.9.2 1.741 2.131 4144 Non-current as Inventaries and work in progres Trade accounts receivable 47.66 12,485 10,923 275 10,88 2.756 70 6.119 Income taxes 12 4 ,864 2.412 Other current amets Cash and cash equivalents Current at 29,95 20.256 27.109 72,748 TOTAL ASSETS 77,271 6 4779 Liabilities and equity Nile Dec 31, 2018 (AX/Rw. ) Share capital Dec 31, 2017 Dec 31, 2016 361 194 61 Share pe 114 152 (34) (72) Chriban Dew tre mury shares Cumulative Wandlation adjustment 1547 245 16 Revalne 574 471 Other 942 942 10.32 2.574 229 Netoli Group whare Equity. Croup share 14.240 12.769 11,136 22.1.12 19.9.2 1241 30.079 1 5.241 Minority interest Equity Long term borrowing Non curve pravilom Derved Other non current labi Non- cu b es Short-term borrowing UNH 36372 32.701 6 .353 7.895 19 2 .511 2 .88 27 46. 85 4 58 200 7 10,0. 9 .870 23,636 24957 38 5 ,650 4 655 21.7 5.314 3 5- RSS 19369404 202 5 ,588 786 17,563 18.105 77,271 72,745 . 21.050 SRM Income taxe Cartpro Other current silicies Current while 4622 100 TOTAL LIABILITIES AND EQUITY 64779 The 2017 D 31, 2016 w o verpliwi with ARDI 2008 1. Consolidated income statement Dec 31, 2018 (12 months) Dec 31, 2017 (12 months) Dec 31, 2016) (6 months) (EUR millis, except for carvings per share) Notes Revenue Cost of sales 33-24 46,826 (15,625) 43.666 (15,105) 28,561 21,436 (7,401) Gross margin 31,201 14,035 (17.752) (3,471) (16,959) (3.251) (8.180) (1.618) Marketing and selling expenses General and administrative expenses Income/(loss) from joint ventures and associates Profit from recurring operations 33-24 10,001 8,351 4,238 (126) Other operating income and expenses Operating profit (184) 8,167 9,875 4,145 Cost of net financial debt Other financial income and expenses (136) (279) (156) (83) (10) 73 Net financial income/expense) (415) (83) (93) (2,518) (1.162) Income taxes Net profit before minority interests (2.259) 5,825 6,942 2,890 Minority interests 4,368 3,566 1.766 Net profit, Group share 2,574 2,259 1,124 Basic Group share of net earnings per share (EUR) Number of shares on which the calculation is based 14.30 180,001,480 12.58 179,596,082 6.27 179,367,681 Diluted Group share of net earnings per share (EUR) 14.25 12.50 6.22 Number of shares on which the calculation is based 180,172,099 180,093,616 179,973,046 (1) The financial statements as of December 31, 2017 and December 31, 2016 have been rested to reflect in particular the retrospective application with effect from July 1, 2016 of IFRS 9 Financial Iwwent See Note 12 1.2.2. Balance sheet as of December 31, 2018 Change +1.4 ASSETS (EUR billion) Property, plant and equipment and intangible assets Other non-current assets Non-current assets Dec 31, 2018 Dec 31, 2017 43.0 41.6 C 4.7 4.0 47.7 12.5 10.9 +0.7 Inventories +1.6 Other current assets +0.9 17.1 29.6 16.2 27.1 Current assets +2.5 ASSETS 77.3 72.7 +4.6 LIABILITIES AND EQUITY (EUR billions) Equity Change +3.7 -1.5 +0.1 6.4 Long-term borrowings Other non-current liabilities Equity and non-current liabilities Short-term borrowings Other current liabilities Current liabilities Dec 31, 2018 Dec 31, 2017 36.4 32.7 7.9 17.1 17.0 59.9 57.6 5.6 4.6 11.8 10.5 17.4 15.1 +1.3 +2.3 LIABILITIES AND EQUITY 77.3 72.7 +4.6 Net financial debt and equity Change -1.5 Dec. 31, 2018 Dec. 31, 2017 6.4 7.9 4.5 12.0 12.4 5.6 +1.1 -0.4 (EUR billions and as %) Long-term borrowings Short-term borrowings and derivatives Gross borrowings after derivatives Cash, cash equivalents and other (a) Adjusted net financial debt (excluding the acquisition of Belmond shares) Total equity (Group share and minority interests) Adjusted net financial debt/Total equity ratio (11.6) (10.4) -0.9 0.4 2.0 -1.6 36.4 32.7 +3.7 1.1% 6.0% -49 pts (a) The adjusted net financial debt (excluding the acquisition of Belmond shares) presented above helps show the impact of the Group's performance in 2018 on the level of net financial debt at the balance sheet date. See Note 18 to the consolidated financial statements