

Answered step by step
Verified Expert Solution
Question
1 Approved Answer
I'm stuck on numbers 3 and 4 only. Thanks Estimating Cost Behavior Using Scattergraph, High-Low, and Least-Squares Regression Methods Sigrid's Custom Graphics specializes in creating
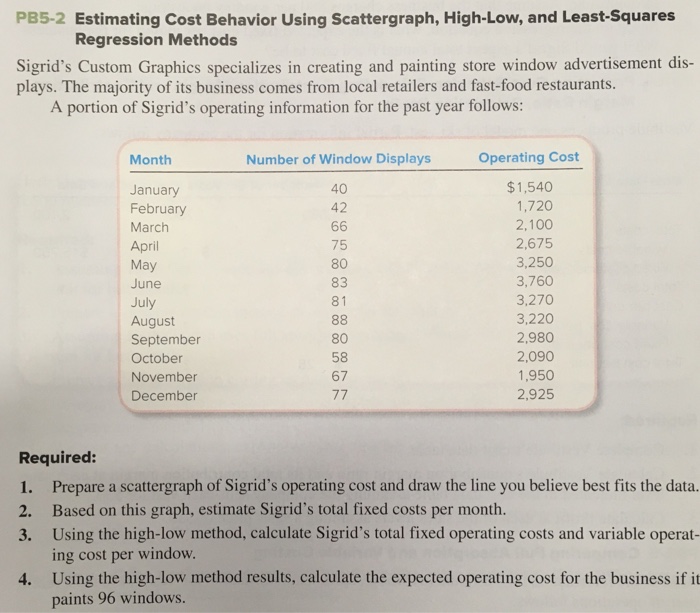
I'm stuck on numbers 3 and 4 only. Thanks
Step by Step Solution
There are 3 Steps involved in it
Step: 1

Get Instant Access to Expert-Tailored Solutions
See step-by-step solutions with expert insights and AI powered tools for academic success
Step: 2

Step: 3
Ace Your Homework with AI
Get the answers you need in no time with our AI-driven, step-by-step assistance
Get Started
Fundamental Financial Accounting Concepts
Authors: J.K.
7th Edition
B003NPRW7I