

Answered step by step
Verified Expert Solution
Question
1 Approved Answer
I'm stuck on this problem. any help would be appreciated Stocks A and B have the returns given in the table below. Complete the steps
I'm stuck on this problem. any help would be appreciated
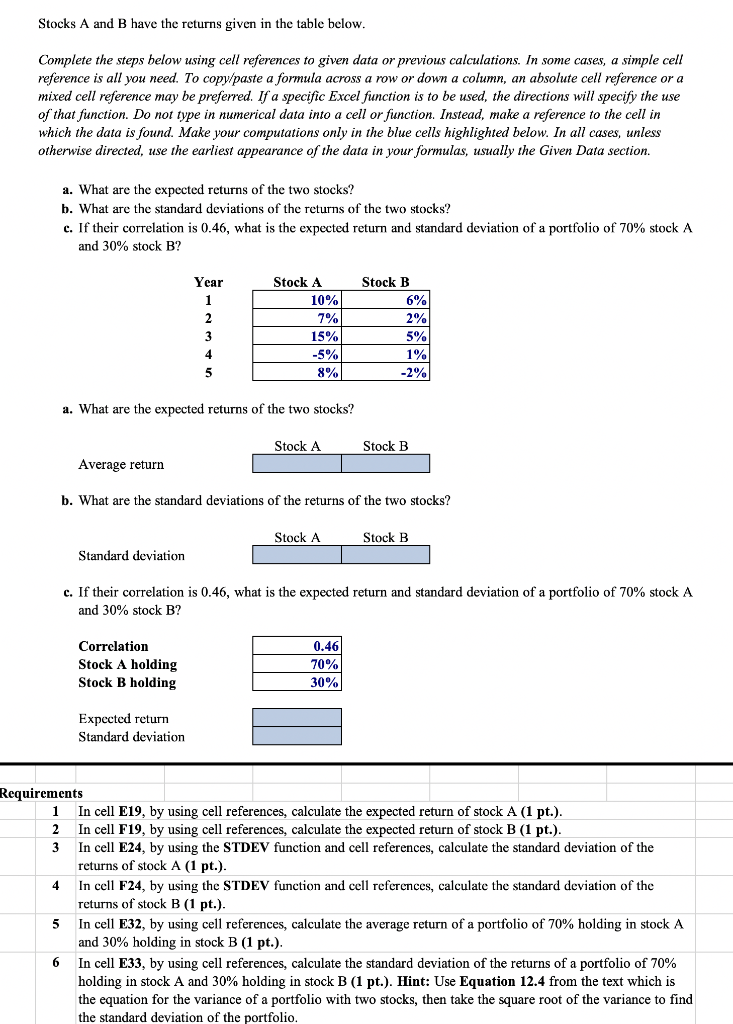
Stocks A and B have the returns given in the table below. Complete the steps below using cell references to given data or previous calculations. In some cases, a simple cell reference is all you need. To copy/paste a formula across a row or down a column, an absolute cell reference or a mixed cell reference may be preferred. If a specific Excel function is to be used, the directions will specify the use of that function. Do not type in numerical data into a cell or function. Instead, make a reference to the cell in which the data is found. Make your computations only in the blue cells highlighted below. In all cases, unless otherwise directed, use the earliest appearance of the data in your formulas, usually the Given Data section. a. What are the expected returns of the two stocks? b. What are the standard deviations of the returns of the two stocks? c. If their correlation is 0.46, what is the expected return and standard deviation of a portfolio of 70% stock A and 30% stock B? Year Stock B 6% Stock A 10% 7% 15% -5% 8% a. What are the expected returns of the two stocks? Stock A Stock B Average return b. What are the standard deviations of the returns of the two stocks? Stock A Stock B Standard deviation c. If their correlation is 0.46, what is the expected return and standard deviation of a portfolio of 70% stock A Correlation Stock A holding Stock B holding 70% 30% Expected return Standard deviation Requirements 1 In cell E19, by using cell references, calculate the expected return of stock A (1 pt.). 2 In cell F19, by using cell references, calculate the expected return of stock B (1 pt.). 3 In cell E24, by using the STDEV function and cell references, calculate the standard deviation of the returns of stock A (1 pt.). In cell F24, by using the STDEV function and cell references, calculate the standard deviation of the returns of stock B (1 pt.). In cell E32, by using cell references, calculate the average return of a portfolio of 70% holding in stock A and 30% holding in stock B (1 pt.). 6 In cell E33, by using cell references, calculate the standard deviation of the returns of a portfolio of 70% holding in stock A and 30% holding in stock B (1 pt.). Hint: Use Equation 12.4 from the text which is the equation for the variance of a portfolio with two stocks, then take the square root of the variance to find the standard deviation of the portfolio. 5Step by Step Solution
There are 3 Steps involved in it
Step: 1

Get Instant Access to Expert-Tailored Solutions
See step-by-step solutions with expert insights and AI powered tools for academic success
Step: 2

Step: 3
Ace Your Homework with AI
Get the answers you need in no time with our AI-driven, step-by-step assistance
Get Started
Crypto Spotlight Series The Graph
Authors: Nott U.r. Keys
1st Edition
979-8854247733