Answered step by step
Verified Expert Solution
Link Copied!

Question

1 Approved Answer

I'm unable to determine equilibrium price n quantity if i plot this graph ? Table 4 Point Price (R) Quantity of wheelbarrows Quantity of wheelbarrows

I'm unable to determine equilibrium price n quantity if i plot this graph ?
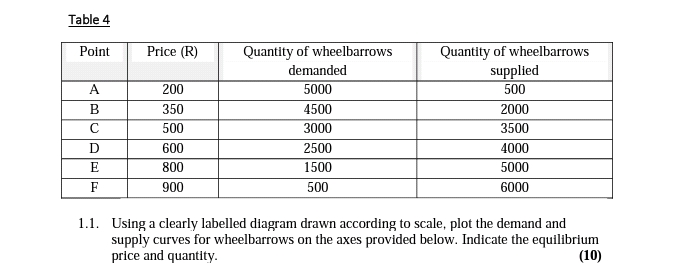
image text in transcribed
Table 4 Point Price (R) Quantity of wheelbarrows Quantity of wheelbarrows demanded supplied A 200 5000 500 B 350 4500 2000 C 500 3000 3500 D 600 2500 4000 E 800 1500 5000 F 900 500 6000 1.1. Using a clearly labelled diagram drawn according to scale, plot the demand and supply curves for wheelbarrows on the axes provided below. Indicate the equilibrium price and quantity

Step by Step Solution

There are 3 Steps involved in it

Step: 1

blur-text-image

Get Instant Access to Expert-Tailored Solutions

See step-by-step solutions with expert insights and AI powered tools for academic success

Step: 2

blur-text-image

Step: 3

blur-text-image

Ace Your Homework with AI

Get the answers you need in no time with our AI-driven, step-by-step assistance

Get Started

Recommended Textbook for

Price theory and applications

Authors: Steven E landsburg

8th edition

538746459, 1133008321, 780538746458, 9781133008323, 978-0538746458

More Books

Students also viewed these Economics questions

Question

4. What should Bob and jim do now to resolve this conflict?

Answered: 1 week ago