Question
Im visiting Acmes impressive new corporate HQ to speak to the management team. Acmes share price has been falling consistently for a while now, despite
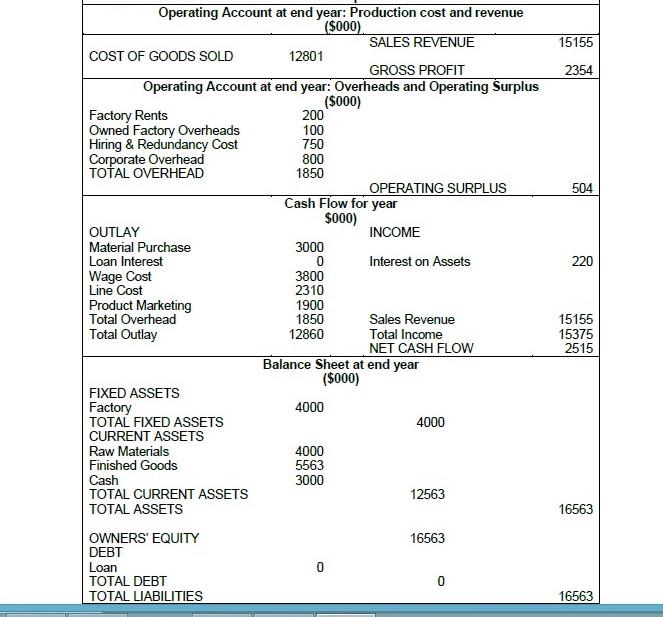
Im visiting Acmes impressive new corporate HQ to speak to the management team. Acmes share price has been falling consistently for a while now, despite the fact that the economy is booming and stock market indices have never been higher. I want to see what those on the ground think. Acme is a key player in producing components for automotive vehicle assembly lines. Its Anvil and Scale products have been successful and well thought of by customers for many years. The lack of growth in these markets, however, encouraged Acme to look for other opportunities three years ago. As a result the company launched the mini Crane for use in the construction trade. The market for cranes is dominated by LiftTech, a global leader in industrial lifting solutions, and Acme has found it hard to transfer its previous success into this fast-growing and competitive market. I spoke to the Operations Director, who told me that the recent economic recovery has resulted in increasing difficulty in attracting and keeping good employees at current pay rates. She also expects the attrition rate to worsen dramatically in the near future and that this could have an impact on quality of output. The Finance Director was more sanguine, noting that Acme has a high Gross Profit, healthy Cash Flow and plenty of inventories. He said, We have kept to our objective of never having to borrow. The recent share price fall is due to short-term investors and unjustified reports in the financial press. The CEO was fairly optimistic. He said, The Crane is taking time to respond to changes I implemented last year. The price increase was designed to increase profits, but market share has fallen from 10% to 8% already. I have every confidence in this product and we will achieve the synergies we were looking for soon. I have just today introduced a no firing policy to rectify our labour problems.
Required: 1) Assess the situation using financial and strategic analysis. Is the no firing policy likely to be the solution to Acmes problems?
2) Analyse Acmes strategic position and suggest a set of options for the short run and the long run.
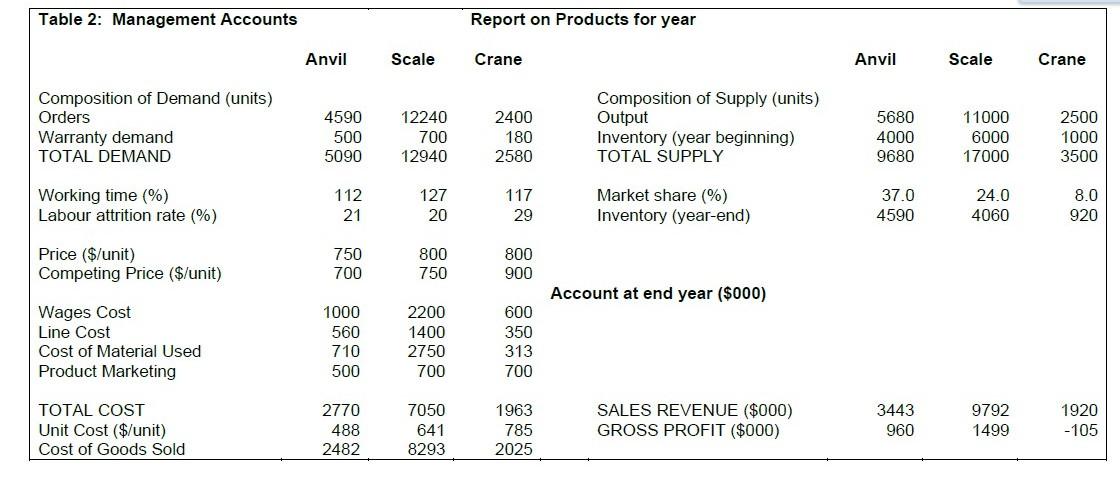
Table 2: Management Accounts Report on Products for year Anvil Scale Crane Anvil Scale Crane Composition of Demand (units) Orders Warranty demand TOTAL DEMAND 4590 500 5090 12240 700 12940 2400 180 2580 Composition of Supply (units) Output Inventory (year beginning) TOTAL SUPPLY 5680 4000 9680 11000 6000 17000 2500 1000 3500 Working time (%) Labour attrition rate (%) 112 21 127 20 117 29 Market share (%) Inventory (year-end) 37.0 4590 24.0 4060 8.0 920 800 Price ($/unit) Competing Price ($/unit) 750 700 800 750 900 Account at end year ($000) 1000 Wages Cost Line Cost Cost of Material Used Product Marketing 560 710 500 2200 1400 2750 700 600 350 313 700 TOTAL COST Unit Cost ($/unit) Cost of Goods Sold 2770 488 2482 7050 641 8293 1963 785 2025 SALES REVENUE ($000) GROSS PROFIT ($000) 3443 960 9792 1499 1920 -105 15155 2354 504 220 Operating Account at end year: Production cost and revenue ($000) SALES REVENUE COST OF GOODS SOLD 12801 GROSS PROFIT Operating Account at end year: Overheads and Operating Surplus ($000) Factory Rents 200 Owned Factory Overheads 100 Hiring & Redundancy Cost 750 Corporate Overhead 800 TOTAL OVERHEAD 1850 OPERATING SURPLUS Cash Flow for year $000) OUTLAY INCOME Material Purchase 3000 Loan Interest 0 Interest on Assets Wage Cost 3800 Line Cost 2310 Product Marketing 1900 Total Overhead 1850 Sales Revenue Total Outlay 12860 Total Income NET CASH FLOW Balance Sheet at end year ($000) FIXED ASSETS Factory 4000 TOTAL FIXED ASSETS 4000 CURRENT ASSETS Raw Materials 4000 Finished Goods 5563 Cash 3000 TOTAL CURRENT ASSETS 12563 TOTAL ASSETS OWNERS' EQUITY 16563 DEBT Loan 0 TOTAL DEBT 0 TOTAL LIABILITIES 15155 15375 2515 16563 16563 Table 2: Management Accounts Report on Products for year Anvil Scale Crane Anvil Scale Crane Composition of Demand (units) Orders Warranty demand TOTAL DEMAND 4590 500 5090 12240 700 12940 2400 180 2580 Composition of Supply (units) Output Inventory (year beginning) TOTAL SUPPLY 5680 4000 9680 11000 6000 17000 2500 1000 3500 Working time (%) Labour attrition rate (%) 112 21 127 20 117 29 Market share (%) Inventory (year-end) 37.0 4590 24.0 4060 8.0 920 800 Price ($/unit) Competing Price ($/unit) 750 700 800 750 900 Account at end year ($000) 1000 Wages Cost Line Cost Cost of Material Used Product Marketing 560 710 500 2200 1400 2750 700 600 350 313 700 TOTAL COST Unit Cost ($/unit) Cost of Goods Sold 2770 488 2482 7050 641 8293 1963 785 2025 SALES REVENUE ($000) GROSS PROFIT ($000) 3443 960 9792 1499 1920 -105 15155 2354 504 220 Operating Account at end year: Production cost and revenue ($000) SALES REVENUE COST OF GOODS SOLD 12801 GROSS PROFIT Operating Account at end year: Overheads and Operating Surplus ($000) Factory Rents 200 Owned Factory Overheads 100 Hiring & Redundancy Cost 750 Corporate Overhead 800 TOTAL OVERHEAD 1850 OPERATING SURPLUS Cash Flow for year $000) OUTLAY INCOME Material Purchase 3000 Loan Interest 0 Interest on Assets Wage Cost 3800 Line Cost 2310 Product Marketing 1900 Total Overhead 1850 Sales Revenue Total Outlay 12860 Total Income NET CASH FLOW Balance Sheet at end year ($000) FIXED ASSETS Factory 4000 TOTAL FIXED ASSETS 4000 CURRENT ASSETS Raw Materials 4000 Finished Goods 5563 Cash 3000 TOTAL CURRENT ASSETS 12563 TOTAL ASSETS OWNERS' EQUITY 16563 DEBT Loan 0 TOTAL DEBT 0 TOTAL LIABILITIES 15155 15375 2515 16563 16563
Step by Step Solution
There are 3 Steps involved in it
Step: 1
Get Instant Access to Expert-Tailored Solutions
See step-by-step solutions with expert insights and AI powered tools for academic success
Step: 2
Step: 3
Ace Your Homework with AI
Get the answers you need in no time with our AI-driven, step-by-step assistance
Get Started