

Question
Image processing class and MATLAB code Image Enhancement Using Intensity Transformations The focus of this project is to experiment with intensity transformations to enhance an
Image processing class and MATLAB code
Image Enhancement Using Intensity Transformations
The focus of this project is to experiment with intensity transformations to enhance an image. Download phoenix lander.tif and enhance it using 1. The log transformation of Note 3, page 8:
g = c log(1 + f )
In (1) the only free parameter is c, but in (2) there are two parameters, k and E for which values have to be selected. As in most enhancement tasks, experimentation is a must. The objective of this project is to obtain the best visual enhancement possible with the methods in (1) and (2). Once (according to your judgment) you have the best visual result for each transformation, explain the reasons for the major differences between them.
As a minimum, your report should include For problem (1): the enhanced image, What is your pick for the parameter c?
In (1) the only free parameter is c. As in most enhancement tasks, experimentation is a must. The objective of this project is to obtain the best visual enhancement possible with the methods in (1). Once (according to your judgment) you have the best visual result for each transformation, explain the reasons for the major differences between them.
if possible, could you put an original picture and an enhanced picture on the solution, please?(any picture is fine)
Thank you in advance
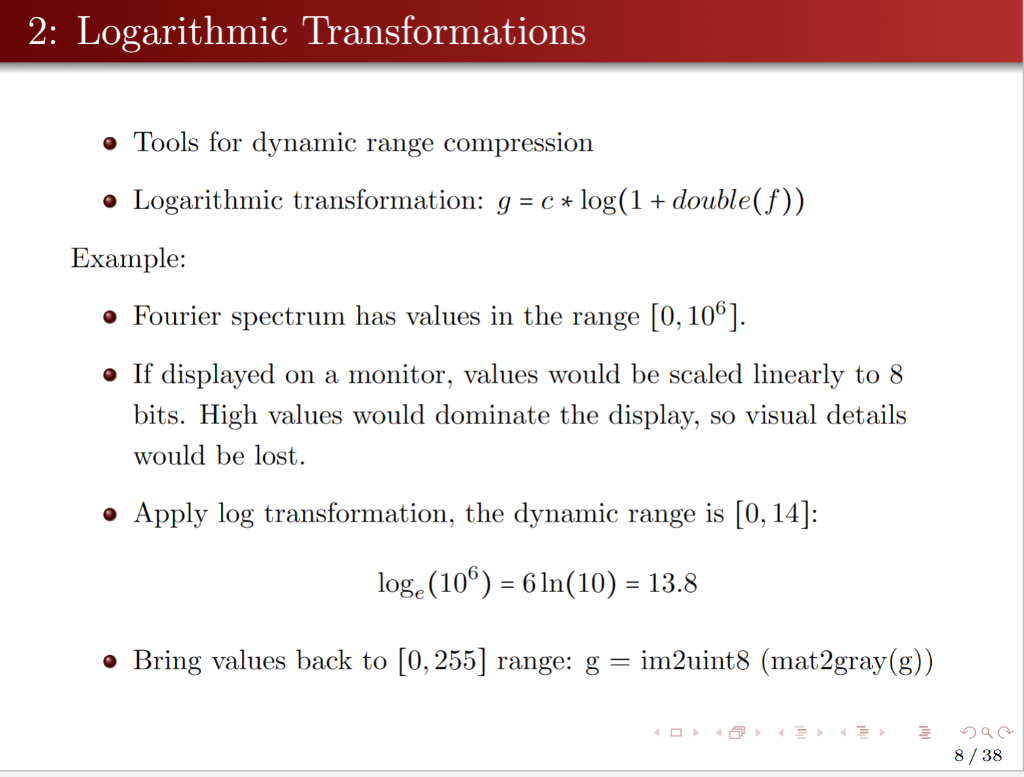
- Tools for dynamic range compression - Logarithmic transformation: g=clog(1+double(f)) Example: - Fourier spectrum has values in the range [0,106]. - If displayed on a monitor, values would be scaled linearly to 8 bits. High values would dominate the display, so visual details would be lost. - Apply log transformation, the dynamic range is [0,14] : loge(106)=6ln(10)=13.8 - Bring values back to [0,255] range: g=im2uint8(mat2gray(g))Step by Step Solution
There are 3 Steps involved in it
Step: 1

Get Instant Access to Expert-Tailored Solutions
See step-by-step solutions with expert insights and AI powered tools for academic success
Step: 2

Step: 3
Ace Your Homework with AI
Get the answers you need in no time with our AI-driven, step-by-step assistance
Get Started
Data Analytics And Quality Management Fundamental Tools
Authors: Joseph Nguyen
1st Edition
B0CNGG3Y2W, 979-8862833232