Answered step by step
Verified Expert Solution
Question
1 Approved Answer
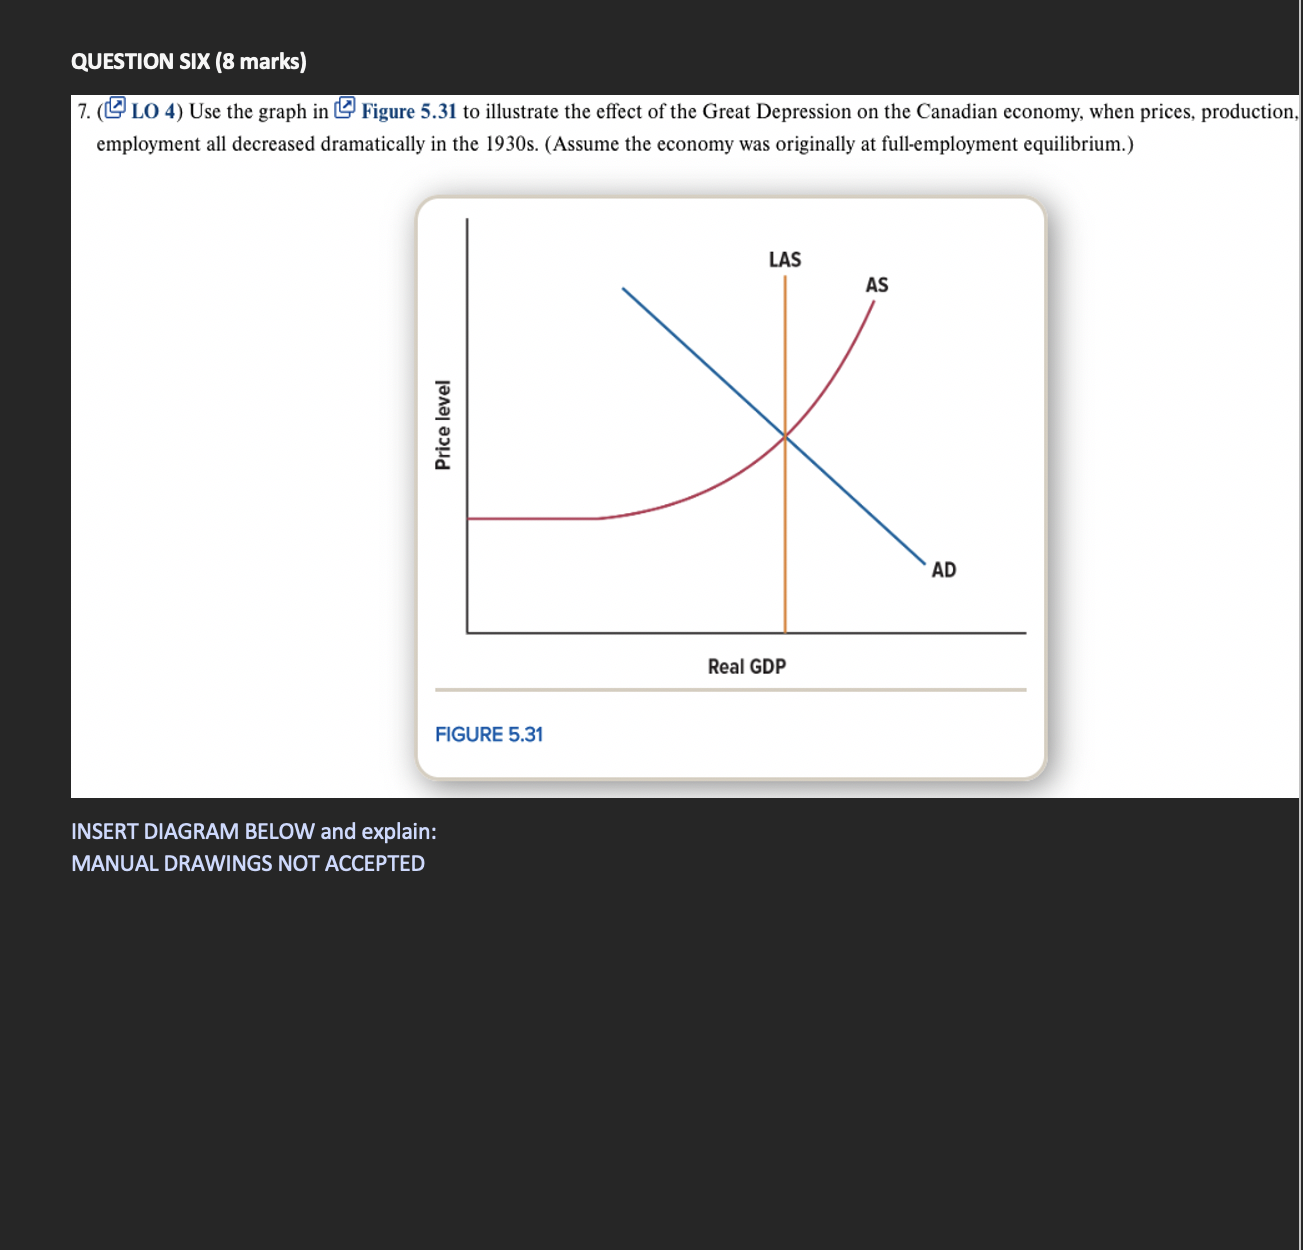
Image transcription text QUESTION SIX (8 marks) 7. ( LO 4) Use the graph in & Figure 5.31 to illustrate the effect of the Great

Image transcription text
QUESTION SIX (8 marks) 7. ( LO 4) Use the graph in & Figure 5.31 to illustrate the effect of the Great Depression on the Canadian economy, when prices, production employment all decreased dramatically in the 1930s. (Assume the economy was originally at full-employment equilibrium.) LAS AS Price level AD Real GDP FIGURE 5.31 INSERT DIAGRAM BELOW and explain: MANUAL DRAWINGS NOT ACCEPTED
QUESTION SIX (8 marks) 7. (LO 4) Use the graph in Figure 5.31 to illustrate the effect of the Great Depression on the Canadian economy, when prices, production, employment all decreased dramatically in the 1930s. (Assume the economy was originally at full-employment equilibrium.) Price level FIGURE 5.31 INSERT DIAGRAM BELOW and explain: MANUAL DRAWINGS NOT ACCEPTED LAS Real GDP AS AD
Step by Step Solution
There are 3 Steps involved in it
Step: 1

Get Instant Access to Expert-Tailored Solutions
See step-by-step solutions with expert insights and AI powered tools for academic success
Step: 2

Step: 3

Ace Your Homework with AI
Get the answers you need in no time with our AI-driven, step-by-step assistance
Get Started


