Question
Imagine that you are a researcher who is interested in whether average job satisfaction differs among people who are short, average, or tall in height.
Imagine that you are a researcher who is interested in whether average job satisfaction differs among people who are short, average, or tall in height.
You measure average job satisfaction, which is shown in the SPSS file as "jobsat". The variable was measured by asking people the following: All things considered, how satisfied are you with your main job? Responses ranged from 1 (completely dissatisfied) to 7 (completely satisfied).
You also have people indicate whether they consider themselves to be short, tall, or average in height. This data is shown in the "height" variable in SPSS. Values are coded as follows:
1 = short
2 = average

What is the null hypothesis for this research question?
The mean of one group will differ from the average job satisfaction of the population.
The mean job satisfaction for tall people is higher than the mean job satisfaction for short people.
Mean job satisfaction will differ between at least two of the height groups.
There is no difference in mean job satisfaction across the three height groups
What is the alternative hypothesis for this research question?
Mean job satisfaction will differ between at least two of the height groups.
There is no difference in mean job satisfaction across the three height groups.
The mean job satisfaction for tall people is higher than the mean job satisfaction for short people.
The mean of one group will differ from the average job satisfaction of the population.
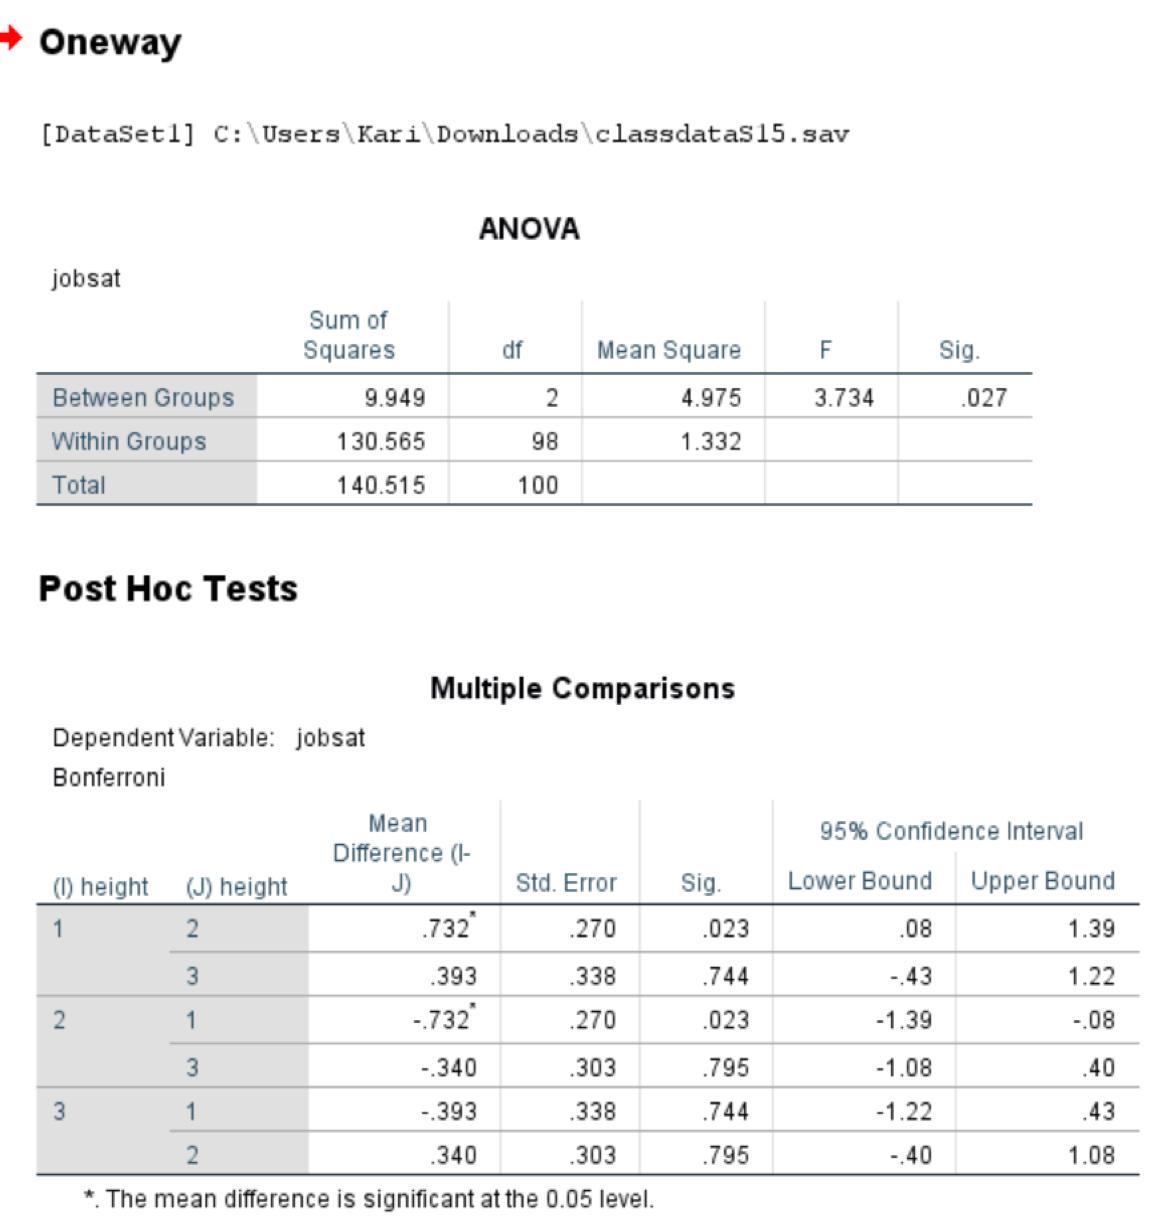
Conduct an ANOVA to see if height is related to job satisfaction. The obtained F-value for the test is ___________ .
Enter your answer rounded to THREE decimal places (i.e., 10.001, not 10.01, not 10, not 10.1).
Oneway [DataSet1] C:\Users\Kari\Downloads\classdataS15.sav jobsat ANOVA Sum of Squares df Mean Square F Sig. Between Groups 9.949 2 4.975 3.734 .027 Within Groups 130.565 98 1.332 Total 140.515 100 Post Hoc Tests Dependent Variable: jobsat Bonferroni Multiple Comparisons Mean Difference (I- 95% Confidence Interval (I) height (J) height J) Std. Error Sig. Lower Bound Upper Bound 1 2 .732" .270 .023 .08 1.39 3 .393 .338 .744 -.43 1.22 2 1 -.732" .270 .023 -1.39 -.08 3 -.340 .303 .795 -1.08 .40 3 1 -.393 .338 .744 -1.22 .43 2 .340 .303 .795 -.40 1.08 *. The mean difference is significant at the 0.05 level.
Step by Step Solution
There are 3 Steps involved in it
Step: 1

Get Instant Access to Expert-Tailored Solutions
See step-by-step solutions with expert insights and AI powered tools for academic success
Step: 2

Step: 3

Ace Your Homework with AI
Get the answers you need in no time with our AI-driven, step-by-step assistance
Get Started


