

Answered step by step
Verified Expert Solution
Question
1 Approved Answer
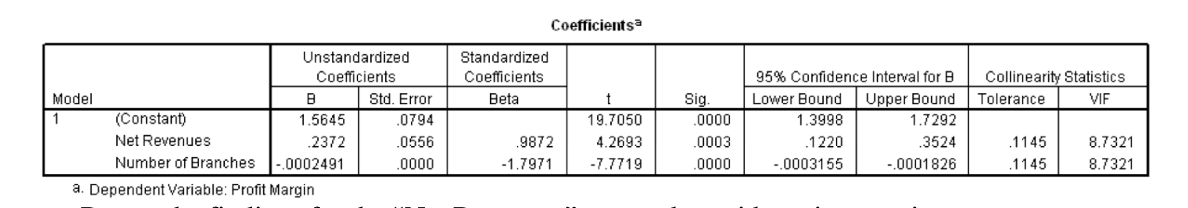
Imagine we are interested in the relationship between an outcome y1(profit margin of savings and loan companies in a given year) and two predictors, x1
- Imagine we are interested in the relationship between an outcome y1(profit margin of savings and loan companies in a given year) and two predictors, x1 (net revenues in that year) and x2 (number of savings and loan branches offices).
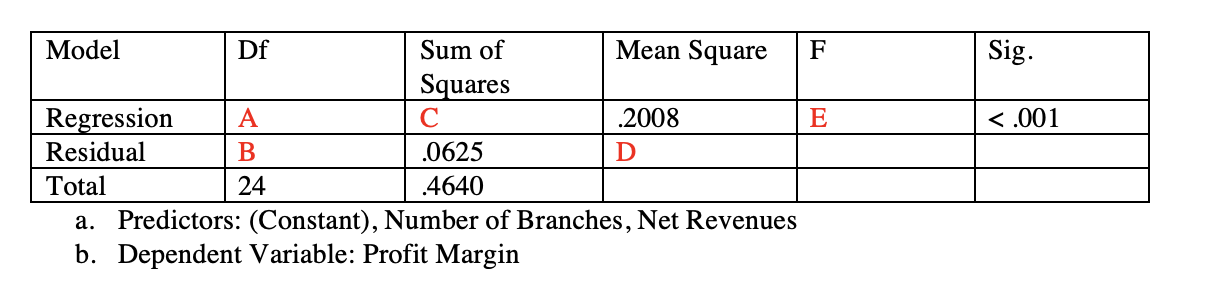
Using the information available, please complete the ANOVA table below.
Step by Step Solution
There are 3 Steps involved in it
Step: 1

Get Instant Access to Expert-Tailored Solutions
See step-by-step solutions with expert insights and AI powered tools for academic success
Step: 2

Step: 3
Ace Your Homework with AI
Get the answers you need in no time with our AI-driven, step-by-step assistance
Get Started
Calculus An Applied Approach
Authors: Ron Larson, Dennis J McKenzie, Larson/Edwards, Bruce H Edwards
7th Edition