Answered step by step
Verified Expert Solution
Question
1 Approved Answer
Implement and evaluate two search algorithms. Input data file: Your input file will be a CSV ( comma separated values ) file Each row in
Implement and evaluate two search algorithms.
Input data file:
Your input file will be a CSV comma separated values file
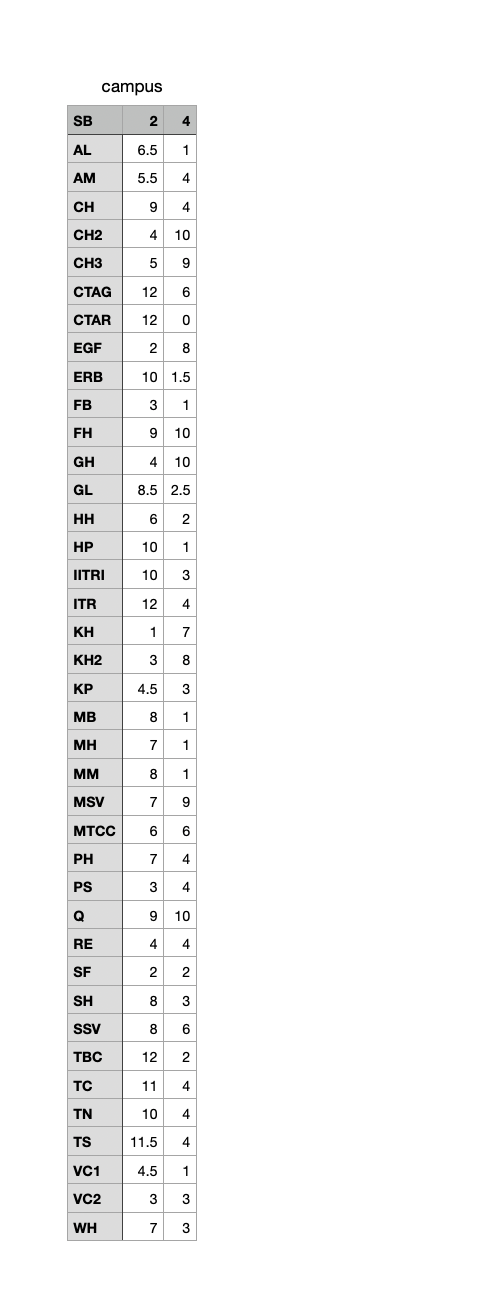
Each row in that input file will correspond to STATE information: STATELABEL, and state D Cartesian space coordinates: X and Y You can assume X and Y to be positive integers.
Problem description:
You are given a weighted complete graph G Your task is to solve a Traveling Salesman Problem TSPfind minimum costweight Hamiltonian Cycle on G using algorithms specified below.
Assume that edge weights represent straight line distances between states.
Your task is to implement two search algorithms in Python:
Simulated Annealing, and
Genetic Algorithm,
and apply them to solve the TSP starting at Stuart Building SB node problem using provided data.
Your program should:
Accept four command line arguments corresponding to two states state capitals initial and goal states so your code could be executed with
python file.py FILENAME ALGO P P
where:
file.py is your python code file name,
FILENAME is the input CSV file name graph G data
ALGO is mode in which your program should operate
Simulated Annealing,
Genetic Algorithm,
P is a value for a specific algorithm parameter:
Simulated Annealing: P is the initial temperature T value,
Genetic Algorithm: P is the number of iterations K
P is a value for a specific algorithm parameter:
Simulated Annealing: P is the alpha parameter for the temperature cooling schedule,
Genetic Algorithm: P is the mutation probability Pm value,
If the number of arguments provided is NOT four your program should display the following error message:
ERROR: Not enough or too many input arguments.
and exit.
Run Simulated Annealing and Genetic Algorithm searches to find the Traveling Salesman Problem solution starting at INITIAL first stateline in the input CSV file state and measure execution time in seconds for both methods.
Report results on screen in the following format:
Initial state: INITIAL
Simulated Annealing:
Command Line Parameters:
Initial solution: LABEL LABEL LABEL LABELN LABELN
Final solution: LABEL LABEL LABEL LABELN LABELN
Number of iterations: AAAA
Execution time: T seconds
Complete path cost: Y
Genetic Algorithm:
Command Line Parameters:
Initial solution: LABEL LABEL LABEL LABELN LABELN
Final solution: LABEL LABEL LABEL LABELN LABELN
Number of iterations: AAAA
Execution time: T seconds
Complete path cost: Y
where:
STARTNODE is the labelname of the initial graph node,
AAAA is the number of iterations completed before termination,
LABEL LABEL LABEL LABELN LABELN is a solution represented as a list of visited states with LABEL STARTNODE and LABELN INITIAL
Save your solutions to a file named:
Simulated Annealing: INPUTFILENAMESOLUTIONSAcsv file.
Genetic Algorithm: INPUTFILENAMESOLUTIONGAcsv file.
Where: INPUTFILENAME is the input file name WITHOUT extension for example for input file DATACSV the GA solution file should be named DATASOLUTIONGAcsv
Algorithm Parameters SPECIFY WHAT IS NOT GIVEN BELOW:
Simulated Annealing parameters are:
Initial state: pick one at random
Initial temperature: T P
What is a move? edge swap
Termination condition: Temperature T
Temperature cooling schedule: exponential Palpha provided as command line argument
TiTinitial eIalpha
Cost objective function:
Genetic Algorithm parameters are:
Individual representation it does not need to be binary:
Population size N
Fitness function:
Selection mechanism: Roulette Wheel,
Probability of crossover: Pc
Crossover mechanism: point crossover with crossover points
Probability of mutation: Pm P
Termination condition: number of iterations P K
Results and Conclusions
and for every ALGOPP value combination provide ONE minaveragemax fitness function plot one plot with three traces; add labels and legend Pick a run that was interesting or best and explain your choice.
What are your conclusions? What have you observed? Which algorithmparameter set performed better? Was the optimal path found? Write a summary below.campus

Step by Step Solution
There are 3 Steps involved in it
Step: 1

Get Instant Access to Expert-Tailored Solutions
See step-by-step solutions with expert insights and AI powered tools for academic success
Step: 2

Step: 3

Ace Your Homework with AI
Get the answers you need in no time with our AI-driven, step-by-step assistance
Get Started


