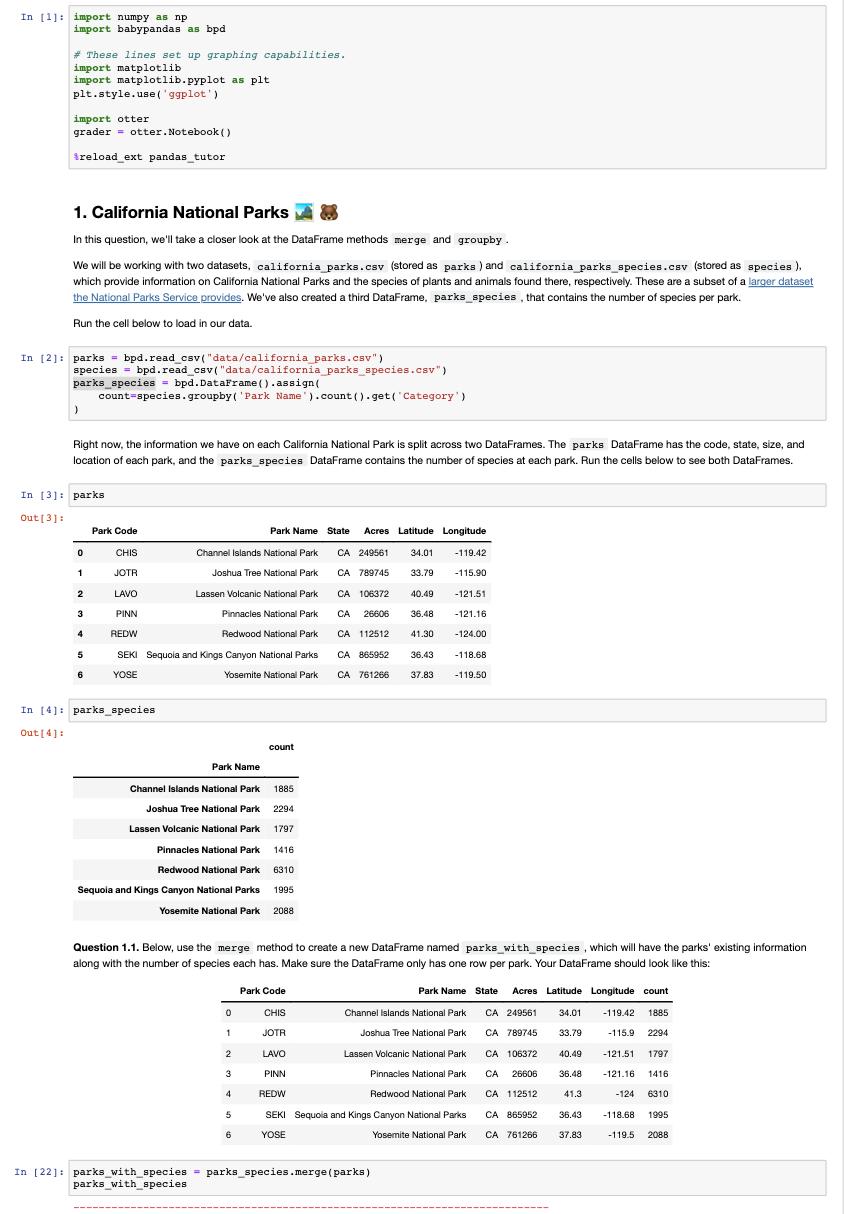
import numpy as np import babypandas as bpd \# These lines set up graphing capabilities. import matplotlib import matplotlib.pyplot as plt plt.style.use('ggplot') import otter grader = otter.Notebook() ireload_ext pandas_tutor 1. California National Parks 83 In this question, we'll take a closer look at the DataFrame methods merge and groupby . We will be working with two datasets, california_parks.csv (stored as parks) and california_parks_species.csv (stored as species ), which provide information on California National Parks and the species of plants and animals found there, respectively. These are a subset of a larger dataset We've also created a third DataFrame, parks_species, that contains the number of species per park. Run the cell below to load in our data. 2]: parks = bpd.read_csv("data/california_parks.csv") species = bpd.read_csv("data/california_parks_species.csv") parks_species = bpd.DataFrame () .assign ( count=species. groupby ('Park Name '). count () . get ('Category') Right now, the information we have on each California National Park is split across two DataFrames. The parks DataFrame has the code, state, size, and location of each park, and the parks_species DataFrame contains the number of species at each park. Run the cells below to see both DataFrames. parks parks_species Question 1.1. Below, use the merge method to create a new DataFrame named parks_with_species, which will have the parks' existing information along with the number of species each has. Make sure the DataFrame only has one row per park. Your DataFrame should look like this: 2]: parks_with_species = parks_species.merge(parks) parks_with_species import numpy as np import babypandas as bpd \# These lines set up graphing capabilities. import matplotlib import matplotlib.pyplot as plt plt.style.use('ggplot') import otter grader = otter.Notebook() ireload_ext pandas_tutor 1. California National Parks 83 In this question, we'll take a closer look at the DataFrame methods merge and groupby . We will be working with two datasets, california_parks.csv (stored as parks) and california_parks_species.csv (stored as species ), which provide information on California National Parks and the species of plants and animals found there, respectively. These are a subset of a larger dataset We've also created a third DataFrame, parks_species, that contains the number of species per park. Run the cell below to load in our data. 2]: parks = bpd.read_csv("data/california_parks.csv") species = bpd.read_csv("data/california_parks_species.csv") parks_species = bpd.DataFrame () .assign ( count=species. groupby ('Park Name '). count () . get ('Category') Right now, the information we have on each California National Park is split across two DataFrames. The parks DataFrame has the code, state, size, and location of each park, and the parks_species DataFrame contains the number of species at each park. Run the cells below to see both DataFrames. parks parks_species Question 1.1. Below, use the merge method to create a new DataFrame named parks_with_species, which will have the parks' existing information along with the number of species each has. Make sure the DataFrame only has one row per park. Your DataFrame should look like this: 2]: parks_with_species = parks_species.merge(parks) parks_with_species