

Answered step by step
Verified Expert Solution
Question
1 Approved Answer
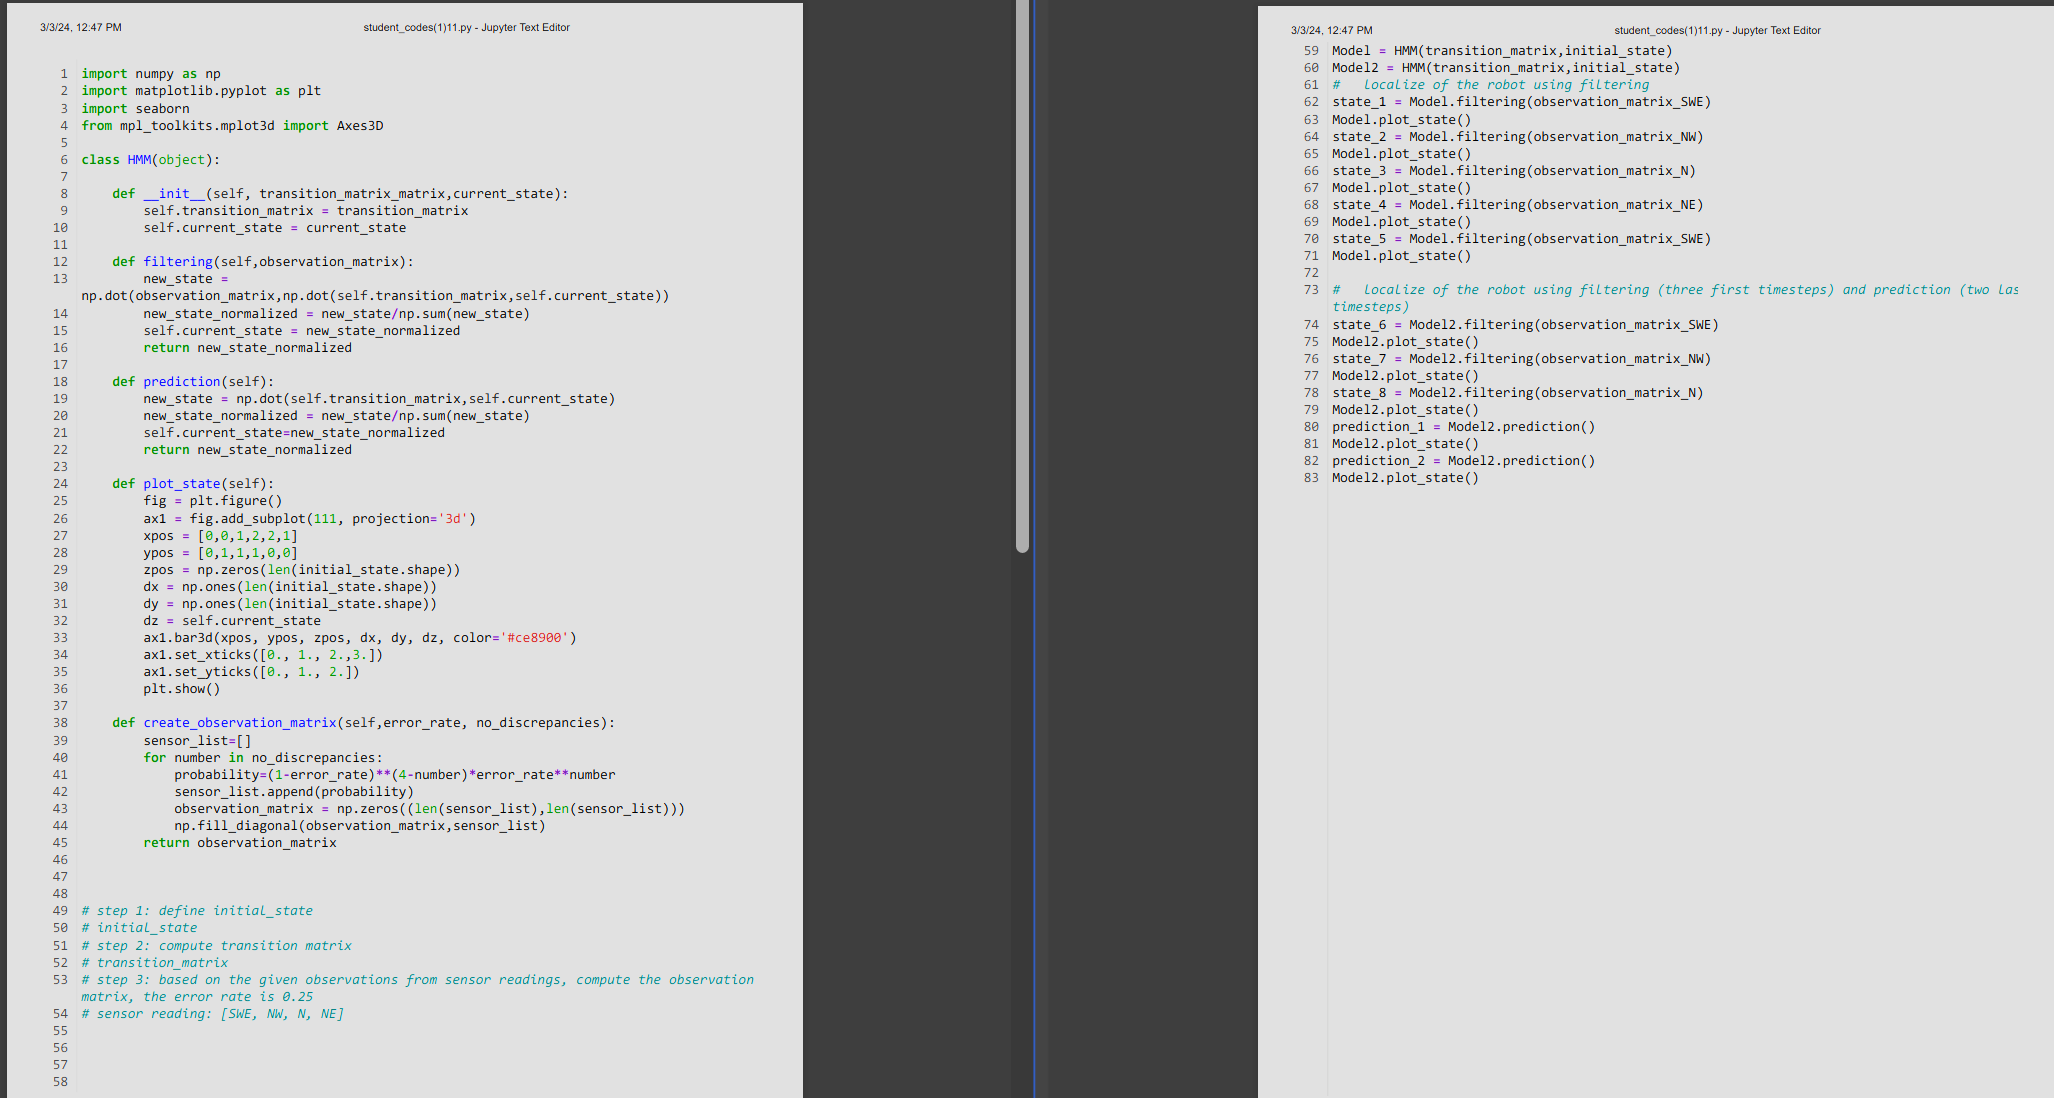
import numpy as np import matplotlib.pyplot as plt import seaborn from mpl _ toolkits.mplot 3 d import Axes 3 D class HMM ( object )
import numpy as np
import matplotlib.pyplot as plt
import seaborn
from mpltoolkits.mplotd import AxesD
class HMMobject:
def initself transitionmatrixmatrix,currentstate:
self.transitionmatrix transitionmatrix
self.currentstate currentstate
def filteringselfobservationmatrix:
newstate npdotobservationmatrix,npdotselftransitionmatrix,self.currentstate
newstatenormalized newstatenpsumnewstate
self.currentstate newstatenormalized
return newstatenormalized
def predictionself:
newstate npdotselftransitionmatrix,self.currentstate
newstatenormalized newstatenpsumnewstate
self.currentstatenewstatenormalized
return newstatenormalized
def plotstateself:
fig pltfigure
ax fig.addsubplot projectiond
xpos
ypos
zpos npzerosleninitialstate.shape
dx nponesleninitialstate.shape
dy nponesleninitialstate.shape
dz self.currentstate
axbardxpos ypos, zpos, dx dy dz color#ce
axsetxticks
axsetyticks
pltshow
def createobservationmatrixselferrorrate, nodiscrepancies:
sensorlist
for number in nodiscrepancies:
probabilityerrorratenumbererrorratenumber
sensorlist.appendprobability
observationmatrix npzeroslensensorlistlensensorlist
npfilldiagonalobservationmatrix,sensorlist
return observationmatrix
# step : define initialstate
# initialstate
# step : compute transition matrix
# transitionmatrix
# step : based on the given observations from sensor readings, compute the observation matrix, the error rate is
# sensor reading: SWE NW N NE
Model HMMtransitionmatrix,initialstate
Model HMMtransitionmatrix,initialstate
# localize of the robot using filtering
state Model.filteringobservationmatrixSWE
Model.plotstate
state Model.filteringobservationmatrixNW
Model.plotstate
state Model.filteringobservationmatrixN
Model.plotstate
state Model.filteringobservationmatrixNE
Model.plotstate
state Model.filteringobservationmatrixSWE
Model.plotstate
# localize of the robot using filtering three first timesteps and prediction two last timesteps
state ModelfilteringobservationmatrixSWE
Modelplotstate
state ModelfilteringobservationmatrixNW
Modelplotstate
state ModelfilteringobservationmatrixN
Modelplotstate
prediction Modelprediction
Modelplotstate
prediction Modelprediction
Modelplotstate
Step by Step Solution
There are 3 Steps involved in it
Step: 1

Get Instant Access to Expert-Tailored Solutions
See step-by-step solutions with expert insights and AI powered tools for academic success
Step: 2

Step: 3
Ace Your Homework with AI
Get the answers you need in no time with our AI-driven, step-by-step assistance
Get Started
OCA Oracle Database SQL Exam Guide Exam 1Z0-071
Authors: Steve O'Hearn
1st Edition
1259585492, 978-1259585494