Answered step by step
Verified Expert Solution
Link Copied!

Question

1 Approved Answer

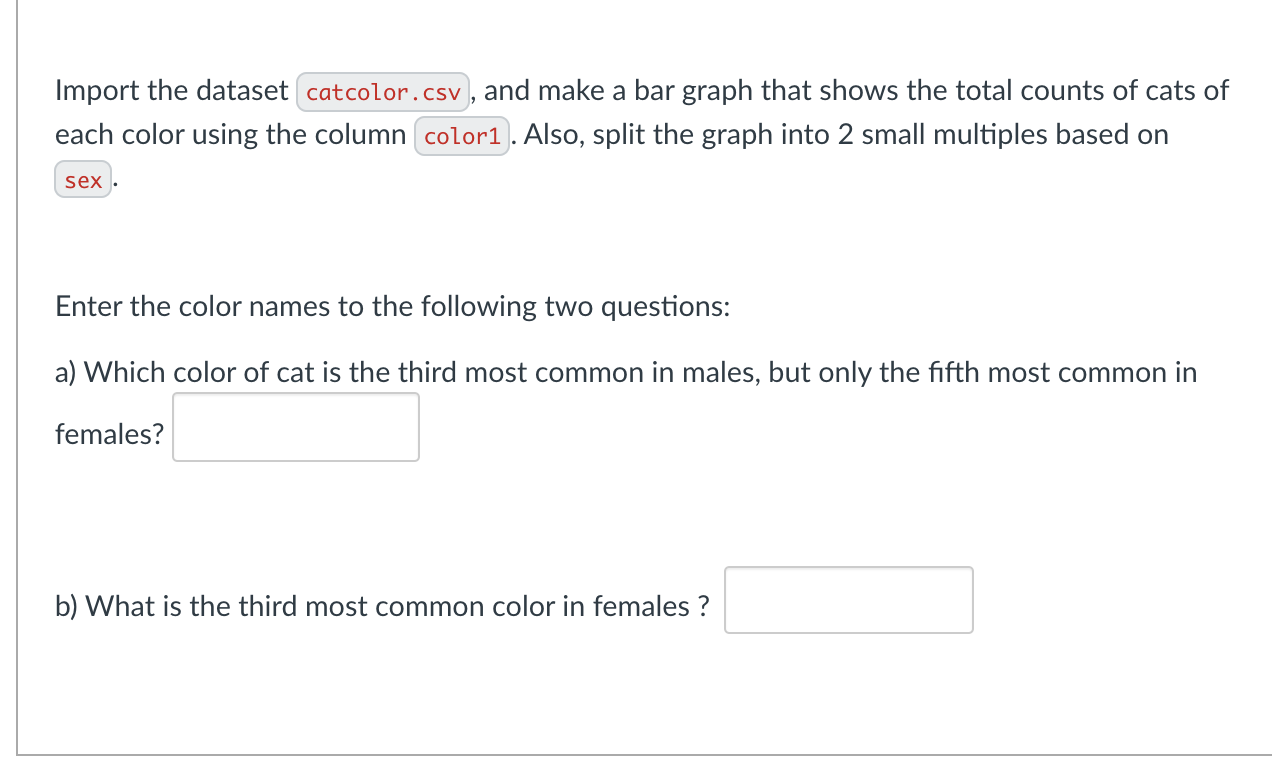
Import the dataset honey1.csv , and make a line graph of total production totalprod (y-axis) as a function of year (x- axis). Make separate lines
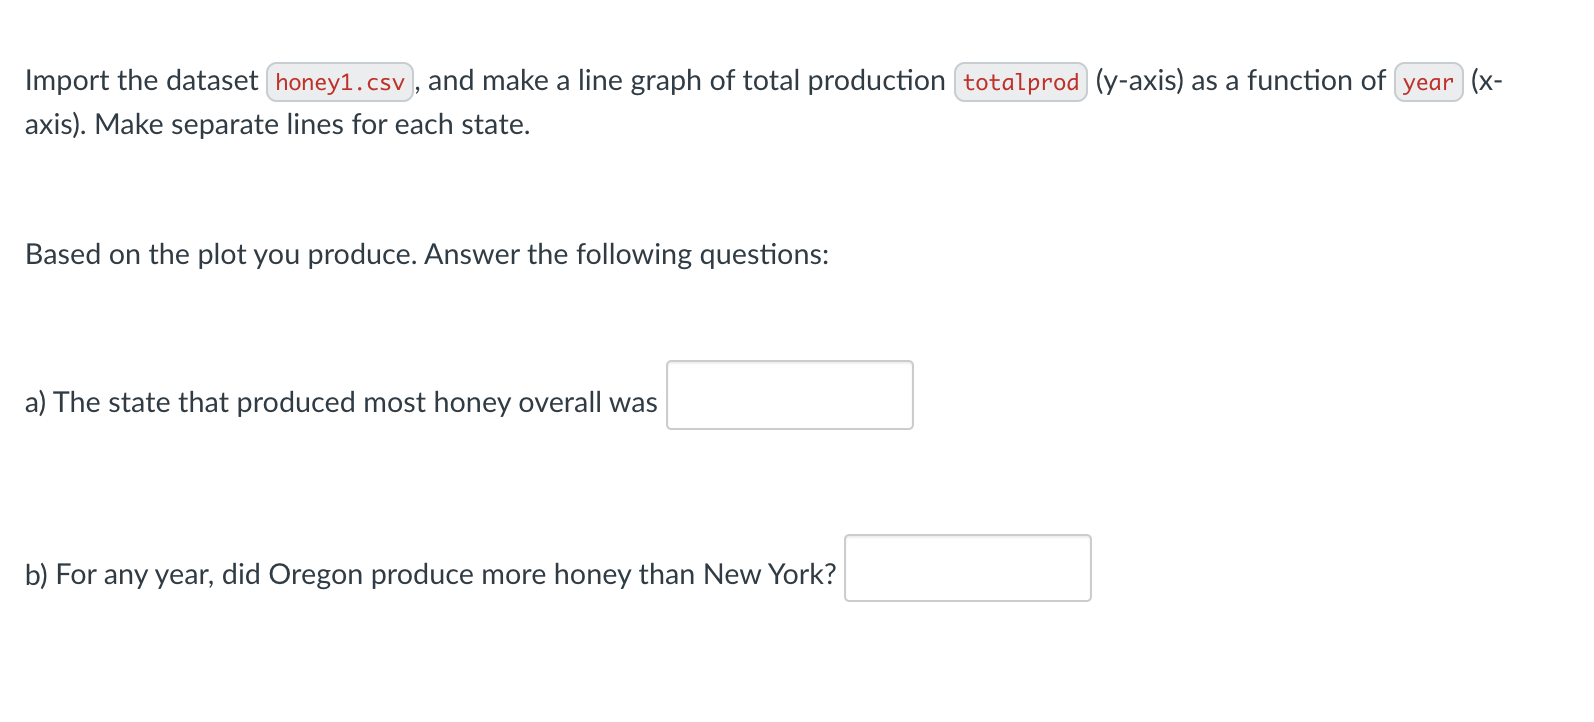
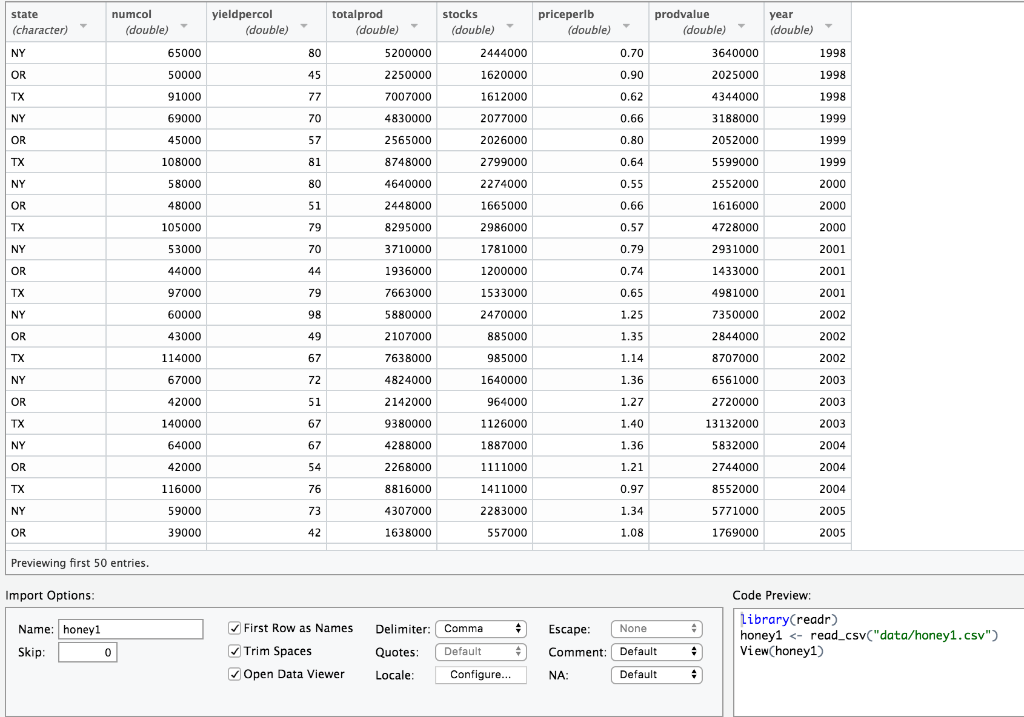
image text in transcribedimage text in transcribedimage text in transcribedimage text in transcribedimage text in transcribedimage text in transcribedimage text in transcribed

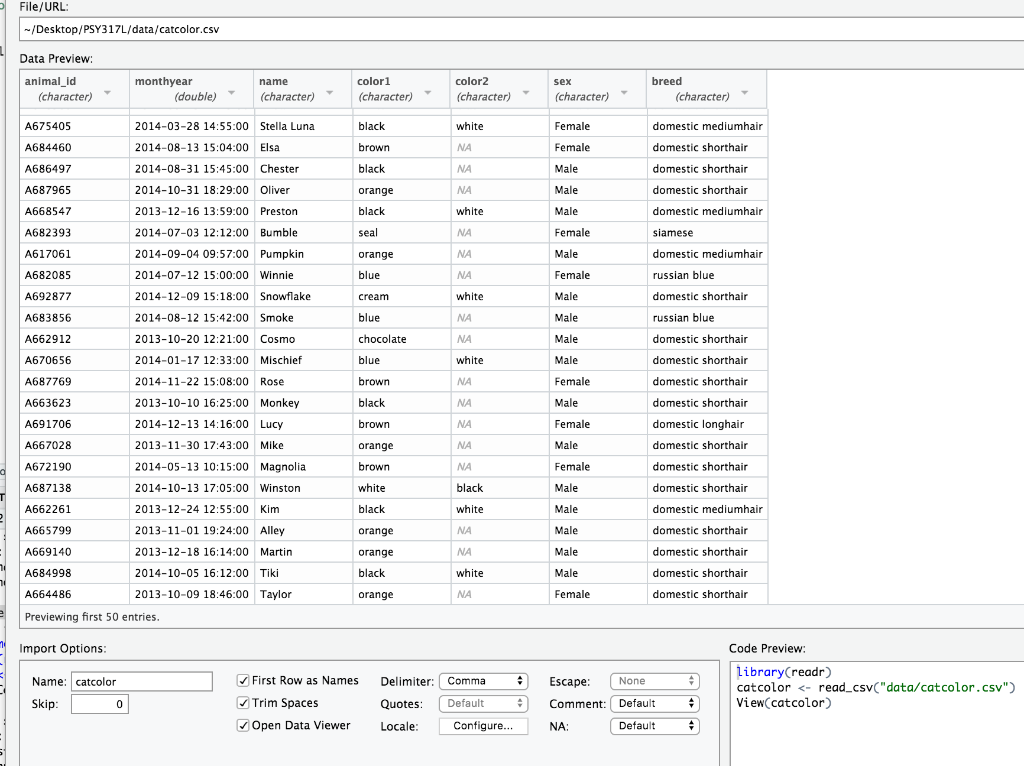
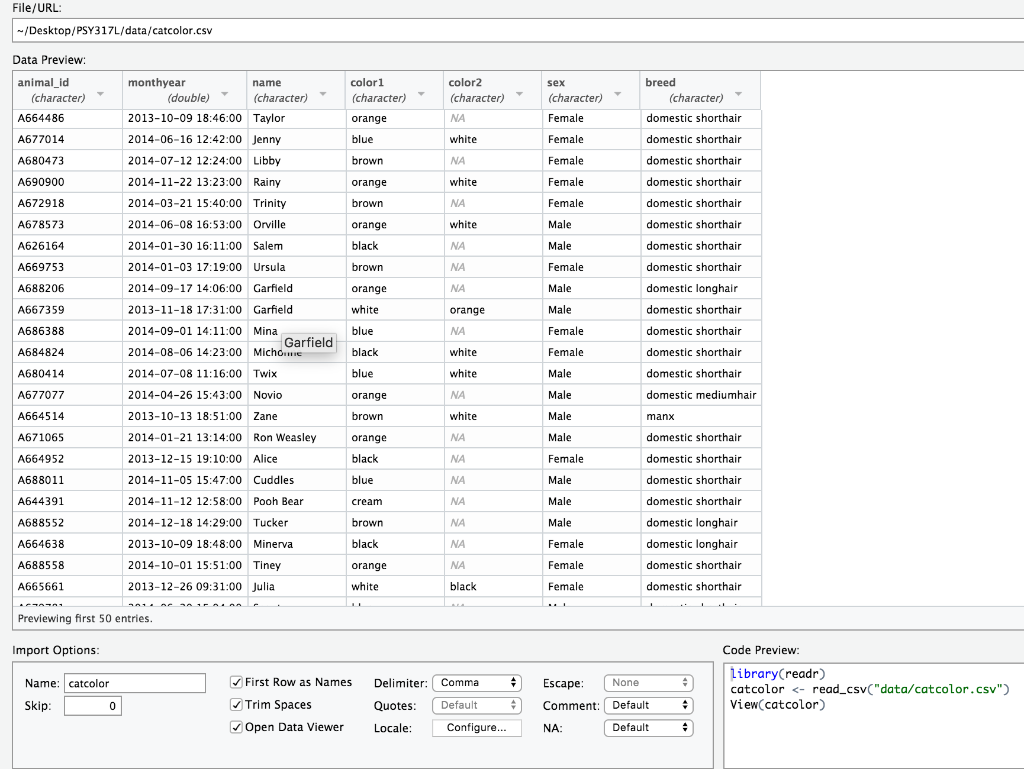
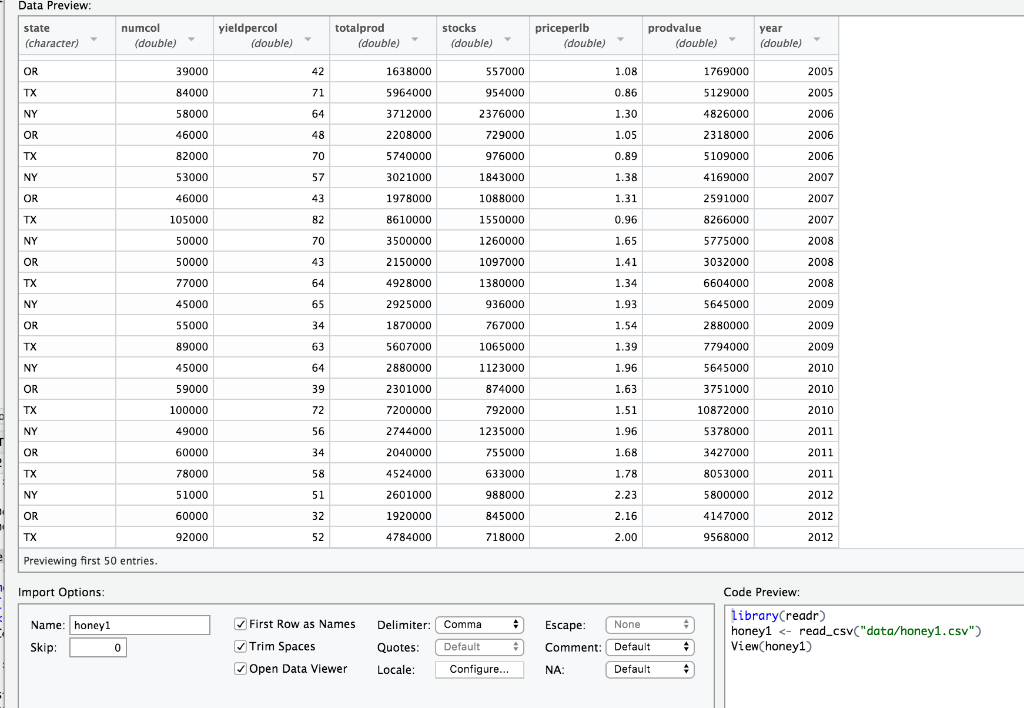
Import the dataset honey1.csv , and make a line graph of total production totalprod (y-axis) as a function of year (x- axis). Make separate lines for each state. Based on the plot you produce. Answer the following questions: a) The state that produced most honey overall was b) For any year, did Oregon produce more honey than New York? state (character) numcol (double) 65000 yieldpercol (double) totalprod (double) 5200000 stocks (double) priceperib (double) prodvalue (double) year (double) NY 80 2444000 0.70 3640000 1998 OR 50000 45 2250000 0.90 2025000 1998 1620000 1612000 TX 77 7007000 0.62 4344000 1998 91000 69000 NY 70 4830000 2077000 0.66 3188000 1999 OR 45000 57 2565000 2026000 0.80 2052000 1999 TX 108000 81 0.64 5599000 1999 8748000 4640000 2799000 2274000 NY 80 0.55 2552000 2000 58000 48000 OR 51 2448000 1665000 0.66 1616000 2000 TX 105000 79 8295000 2986000 0.57 4728000 2000 NY 53000 70 1781000 0.79 2931000 2001 3710000 1936000 OR 44000 44 1200000 0.74 1433000 2001 TX 97000 79 7663000 0.65 2001 1533000 2470000 4981000 7350000 NY 60000 98 5880000 1.25 2002 OR 49 885000 1.35 2844000 2002 43000 114000 67000 2107000 7638000 TX 67 1.14 8707000 985000 1640000 2002 2003 NY 72 4824000 1.36 6561000 OR 42000 51 2142000 964000 1.27 2720000 2003 TX 140000 67 9380000 1126000 1.40 13132000 2003 NY 64000 67 1887000 1.36 2004 4288000 2268000 OR 42000 54 1111000 1.21 2004 TX 116000 76 8816000 1411000 0.97 5832000 2744000 8552000 5771000 1769000 2004 NY 59000 73 4307000 1.34 2005 2283000 557000 OR 39000 42 1638000 1.08 2005 Previewing first 50 entries. Import Options: Code Preview Delimiter: Comma Name: honey1 Skip: 0 0 First Row as Names Trim Spaces Open Data Viewer Default Library(readr) honey1
Step by Step Solution

There are 3 Steps involved in it

Step: 1

blur-text-image

Get Instant Access to Expert-Tailored Solutions

See step-by-step solutions with expert insights and AI powered tools for academic success

Step: 2

blur-text-image

Step: 3

blur-text-image

Ace Your Homework with AI

Get the answers you need in no time with our AI-driven, step-by-step assistance

Get Started

Recommended Textbook for

Databases A Beginners Guide

Authors: Andy Oppel

1st Edition

007160846X, 978-0071608466

More Books

Students also viewed these Databases questions

Question

Draw and explain the operation of LVDT for pressure measurement

Answered: 1 week ago