Answered step by step
Verified Expert Solution
Question
1 Approved Answer
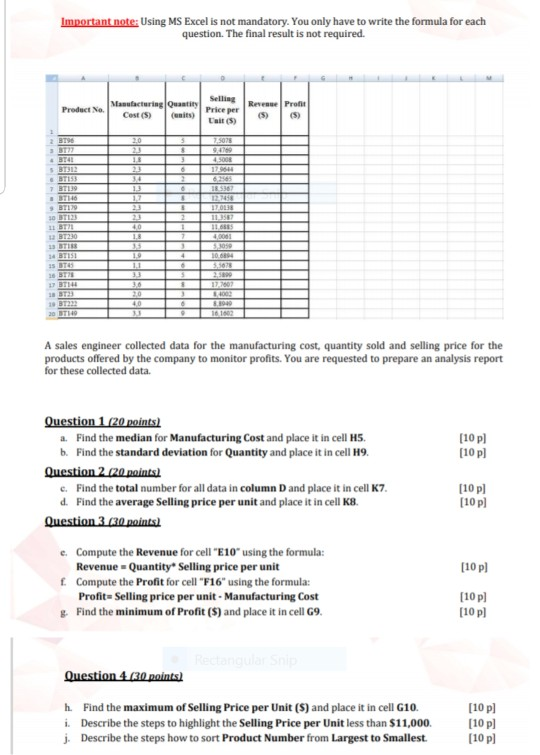
Important note: Using MS Excel is not mandatory. You only have to write the formula for each question. The final result is not required. Selling

Important note: Using MS Excel is not mandatory. You only have to write the formula for each question. The final result is not required. Selling Price per Manufacturing Quantity Cost (5) (units) Product No. Reresse Profit (5) (5) 35078 23 3 $ 3 1764 3 T153 7 BT130 TH BTI 27 12740 170138 2 1 11 BT BT10 40 1.8 11 6815 4,000 19 4 6 5 8 106 35078 2,50 10 ST BTI 123 36 . 81000 16 1802 20 DT149 A sales engineer collected data for the manufacturing cost, quantity sold and selling price for the products offered by the company to monitor profits. You are requested to prepare an analysis report for these collected data. [10 pl [10p] [10p] [10p] Question 1 (20 points) a. Find the median for Manufacturing Cost and place it in cell H5. b. Find the standard deviation for Quantity and place it in cell H9. Question 2 (20 points) c. Find the total number for all data in column D and place it in cell K7. d. Find the average Selling price per unit and place it in cell K8. Question 3.30 points) e. Compute the Revenue for cell "E10 using the formula: Revenue - Quantity* Selling price per unit f Compute the Profit for cell "F16" using the formula: Profit-Selling price per unit - Manufacturing Cost Find the minimum of Profit ($) and place it in cell G9. [10p] [10p] [10p] Rectangulat Question 4 (30 points) h. Find the maximum of Selling Price per Unit (S) and place it in cell G10. i. Describe the steps to highlight the Selling Price per Unit less than $11,000 j. Describe the steps how to sort Product Number from Largest to Smallest. [10 pl [10 pl [10p] Important note: Using MS Excel is not mandatory. You only have to write the formula for each question. The final result is not required. Selling Price per Manufacturing Quantity Cost (5) (units) Product No. Reresse Profit (5) (5) 35078 23 3 $ 3 1764 3 T153 7 BT130 TH BTI 27 12740 170138 2 1 11 BT BT10 40 1.8 11 6815 4,000 19 4 6 5 8 106 35078 2,50 10 ST BTI 123 36 . 81000 16 1802 20 DT149 A sales engineer collected data for the manufacturing cost, quantity sold and selling price for the products offered by the company to monitor profits. You are requested to prepare an analysis report for these collected data. [10 pl [10p] [10p] [10p] Question 1 (20 points) a. Find the median for Manufacturing Cost and place it in cell H5. b. Find the standard deviation for Quantity and place it in cell H9. Question 2 (20 points) c. Find the total number for all data in column D and place it in cell K7. d. Find the average Selling price per unit and place it in cell K8. Question 3.30 points) e. Compute the Revenue for cell "E10 using the formula: Revenue - Quantity* Selling price per unit f Compute the Profit for cell "F16" using the formula: Profit-Selling price per unit - Manufacturing Cost Find the minimum of Profit ($) and place it in cell G9. [10p] [10p] [10p] Rectangulat Question 4 (30 points) h. Find the maximum of Selling Price per Unit (S) and place it in cell G10. i. Describe the steps to highlight the Selling Price per Unit less than $11,000 j. Describe the steps how to sort Product Number from Largest to Smallest. [10 pl [10 pl [10p]
Step by Step Solution
There are 3 Steps involved in it
Step: 1

Get Instant Access to Expert-Tailored Solutions
See step-by-step solutions with expert insights and AI powered tools for academic success
Step: 2

Step: 3

Ace Your Homework with AI
Get the answers you need in no time with our AI-driven, step-by-step assistance
Get Started


