

Answered step by step
Verified Expert Solution
Question
1 Approved Answer
important note : you just have to solve the question 3 for the year 2016 REITMANS (CANADA) LIMITED CONSOLIDATED BALANCE SHEETS As at January 28,
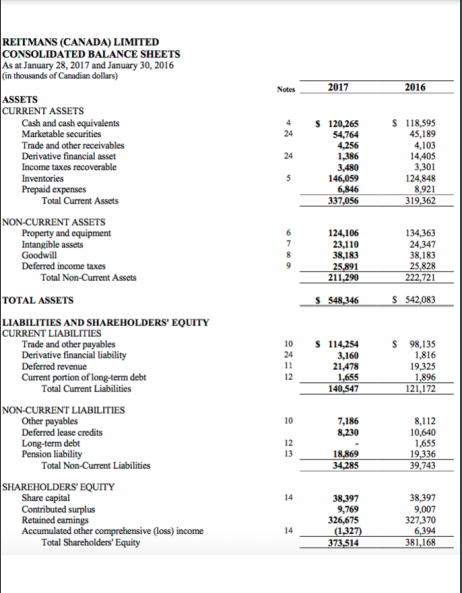
important note : you just have to solve the question 3 for the year 2016
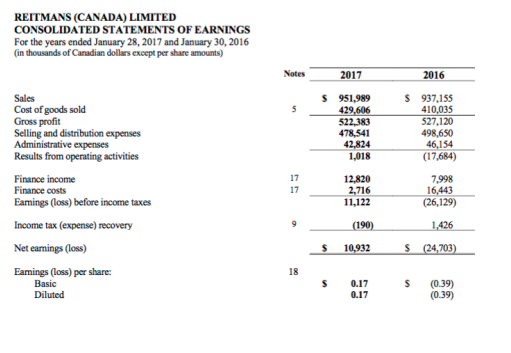
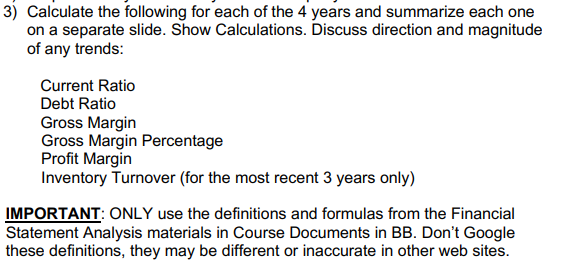
REITMANS (CANADA) LIMITED CONSOLIDATED BALANCE SHEETS As at January 28, 2017 and January 30, 2016 (in thousands of Canadian dollars) Notes 2017 2016 4 24 24 $ 120,265 54,764 4,256 1,386 3,480 146,059 6,846 337,056 $ 118,595 45,189 4,103 14,405 3,301 124,848 8,921 319,362 5 7 124,106 23.110 38,183 25,891 211,290 134,363 24,347 38,183 25,828 222,721 $ 548,346 $ 542,083 ASSETS CURRENT ASSETS Cash and cash equivalents Marketable securities Trade and other receivables Derivative financial asset Income taxes recoverable Inventories Prepaid expenses Total Current Assets NON-CURRENT ASSETS Property and equipment Intangible assets Goodwill Deferred income taxes Total Non-Current Assets TOTAL ASSETS LIABILITIES AND SHAREHOLDERS' EQUITY CURRENT LIABILITIES Trade and other payables Derivative financial liability Deferred revenue Current portion of long-term debt Total Current Liabilities NON-CURRENT LIABILITIES Other payables Deferred lease credits Long-term debt Pension liability Total Non-Current Liabilities SHAREHOLDERS' EQUITY Share capital Contributed surplus Retained eamings Accumulated other comprehensive (loss) income Total Shareholders' Equity 10 24 $ 114,254 3,160 21,478 1,655 140,547 $ 98,135 1,816 19,325 1,896 121,172 12 10 7,186 8,230 12 13 8,112 10,640 1,655 19,336 39,743 18.869 34,285 14 38,397 9,769 326,675 (1.327) 373.514 38,397 9,007 327,370 6,394 381,168 14 REITMANS (CANADA) LIMITED CONSOLIDATED STATEMENTS OF EARNINGS For the years ended January 28, 2017 and January 30, 2016 (in thousands of Canadian dollars except per share amounts) Notes 2017 2016 5 $ 951,989 429,606 522,383 478,541 42,824 1,018 S 937,155 410,035 527.120 498,650 46,154 (17,684) 17 17 Sales Cost of goods sold Gross profit Selling and distribution expenses Administrative expenses Results from operating activities Finance income Finance costs Famings (loss) before income taxes Income tax (expense) recovery Net earnings (loss) Famings (loss) per share: Basic Diluted 12.820 2,716 11,122 7,998 16,443 (26,129) (190) 1,426 10,932 s (24,703) 18 s s 0.17 0.17 (0.39) (0.39) 3) Calculate the following for each of the 4 years and summarize each one on a separate slide. Show Calculations. Discuss direction and magnitude of any trends: Current Ratio Debt Ratio Gross Margin Gross Margin Percentage Profit Margin Inventory Turnover (for the most recent 3 years only) IMPORTANT: ONLY use the definitions and formulas from the Financial Statement Analysis materials in Course Documents in BB. Don't Google these definitions, they may be different or inaccurate in other web sitesStep by Step Solution
There are 3 Steps involved in it
Step: 1

Get Instant Access to Expert-Tailored Solutions
See step-by-step solutions with expert insights and AI powered tools for academic success
Step: 2

Step: 3
Ace Your Homework with AI
Get the answers you need in no time with our AI-driven, step-by-step assistance
Get Started
Ready Notes For Use With Managerial Accounting
Authors: Ronald W. Hilton
4th Edition
0073656518, 978-0073656519