Question
In 1969, Tom Warren founded East Coast Yachts. The company has manufactured custom mid-size, high-performance yachts for clients and its products have received high reviews
In 1969, Tom Warren founded East Coast Yachts. The company has manufactured custom mid-size, high-performance yachts for clients and its products have received high reviews for safety and reliability. The yachts are primarily purchased by wealthy individuals for pleasure use. The company's operations are located near Hilton Head Island, South Carolina, and the company is now structured as a corporation following initially being structured as a sole proprietorship.
The custom yacht industry is fragmented with a number of manufacturers. As with many industries, there are market leaders, but the diverse nature of the industry ensures that no manufacturer dominates the market. The competition in the market and the overall cost of a well-built yacht ensures that attention to product detail and quality is of upmost importance.
Several years ago, Tom Warren retired and turned the day-to-day operations of the company over to his daughter, Larissa. Dan Ervin was recently hired by East Coast Yachts to assist the company with its financial planning and also to evaluate the company's financial performance. Dan graduated with a MBA 5 years ago and was most recently employed in the treasury department of a Fortune 500 company.
Larissa wants Dan to find out how East Coast Yachts is performing relative to its peers. Additionally, she wants to find out the future financing necessary to fund the company's growth. In the past, East Coast Yachts experienced difficulty in financing its growth plans, in large part because of poor planning. Larissa hoped that Dan would be able to estimate the amount of capital the company would have to raise next year so that East Coast Yachts would be better prepared to fund its expansion plans.
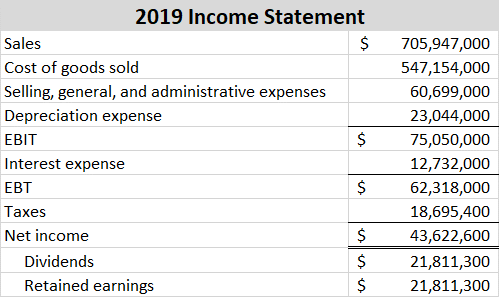
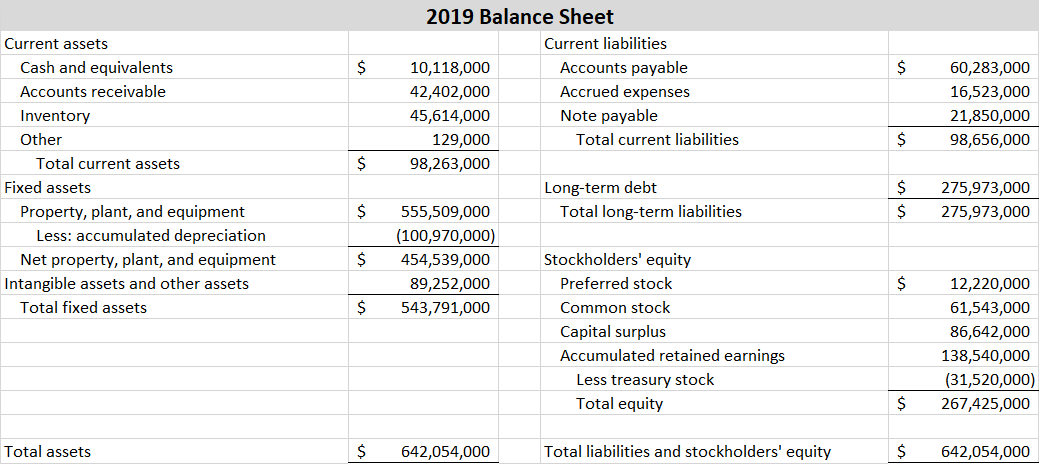
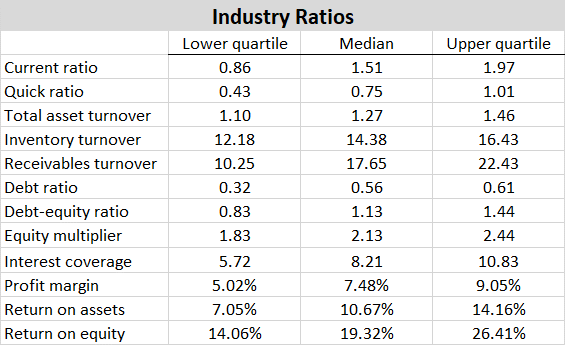
To get Dan started with his analyses, Larissa provided the following financial statements. Dan then gathered the industry ratios for the yacht manufacturing industry.
Answer the questions below. As an aid, a spreadsheet file with the financial statements and industry ratios presented above is available on the D2L website for your use. The file is entitled Assignment 2-Data.
1) Calculate all of the ratios listed in the industry ratios table for East Coast Yachts.
2) For each of East Coast Yachts' ratios, comment on why it might be viewed as a positive or negative relative to the industry. Discuss the overall performance of East Coast Yachts relative to its industry.
3) Calculate the sustainable growth rate for East Coast Yachts using the formula below. (JUST ANSWER THIS QUESTION).
Sustainable Growth = ROE x b / 1- ROE x b


Step by Step Solution
There are 3 Steps involved in it
Step: 1

Get Instant Access to Expert-Tailored Solutions
See step-by-step solutions with expert insights and AI powered tools for academic success
Step: 2

Step: 3

Ace Your Homework with AI
Get the answers you need in no time with our AI-driven, step-by-step assistance
Get Started


