Answered step by step
Verified Expert Solution
Question
1 Approved Answer
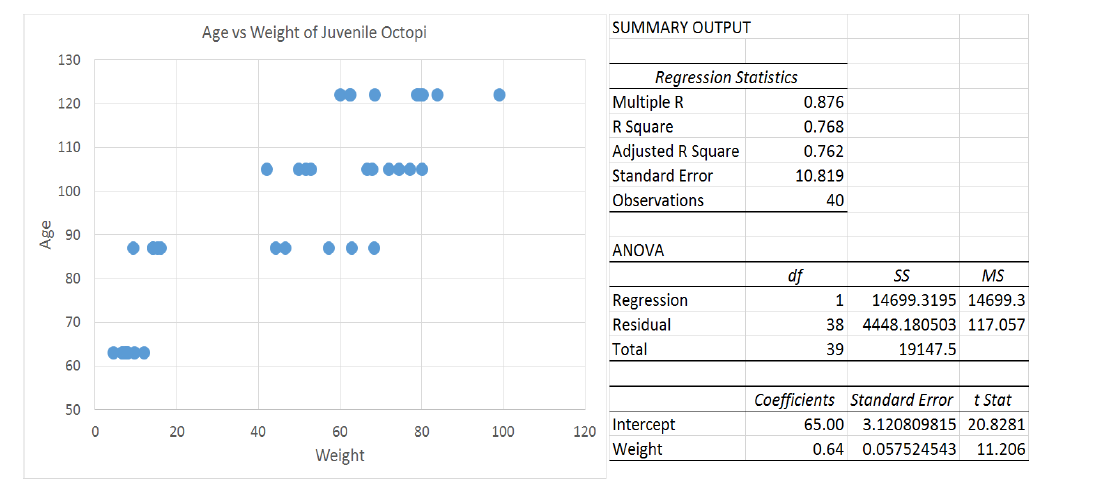
In 2014, Barcenas et al. sampled 40 juvenile octopi and measure their weight (grams) and age (days). The results of their regression analysis are given
In 2014, Barcenas et al. sampled 40 juvenile octopi and measure their weight (grams)
and age (days). The results of their regression analysis are given below.
- Comment on the relationship shown by the scatterplot.
- Give the simple linear regression equation using weight to predict age.
- What change in age is associated with an increase in weight of 1 gram?
- What percent of the variation in age is explained by the linear relationship with weight?

Step by Step Solution
There are 3 Steps involved in it
Step: 1

Get Instant Access to Expert-Tailored Solutions
See step-by-step solutions with expert insights and AI powered tools for academic success
Step: 2

Step: 3

Ace Your Homework with AI
Get the answers you need in no time with our AI-driven, step-by-step assistance
Get Started


