

Question
In 2022, PT Rent had excess cash. The management decided that the excess cash would be invested in the debt instruments. On September 30, 2022,
In 2022, PT Rent had excess cash. The management decided that the excess cash would be invested in the debt instruments. On September 30, 2022, the company purchased PT Birdy bonds at a price of Rp171,161.79 million (of Rp200 million nominal value). The bonds have a 5-year tenor, an 8% coupon rate paid annually, and an effective interest rate of 12%. This instrument has met the SPPI criteria. This instrument is managed by Treasury Division whose intent is to ensure that level of liquidity. The division does not always conduct sales of its bonds. Sometimes, when liquidity is in a tight condition, the bonds may be held to maturity. When historical data are consulted, the bonds nominal values sold before maturity equal, in most cases, the nominal values of bonds held to maturity. The market value of the bonds at 31 December 2022 is Rp160,500 million
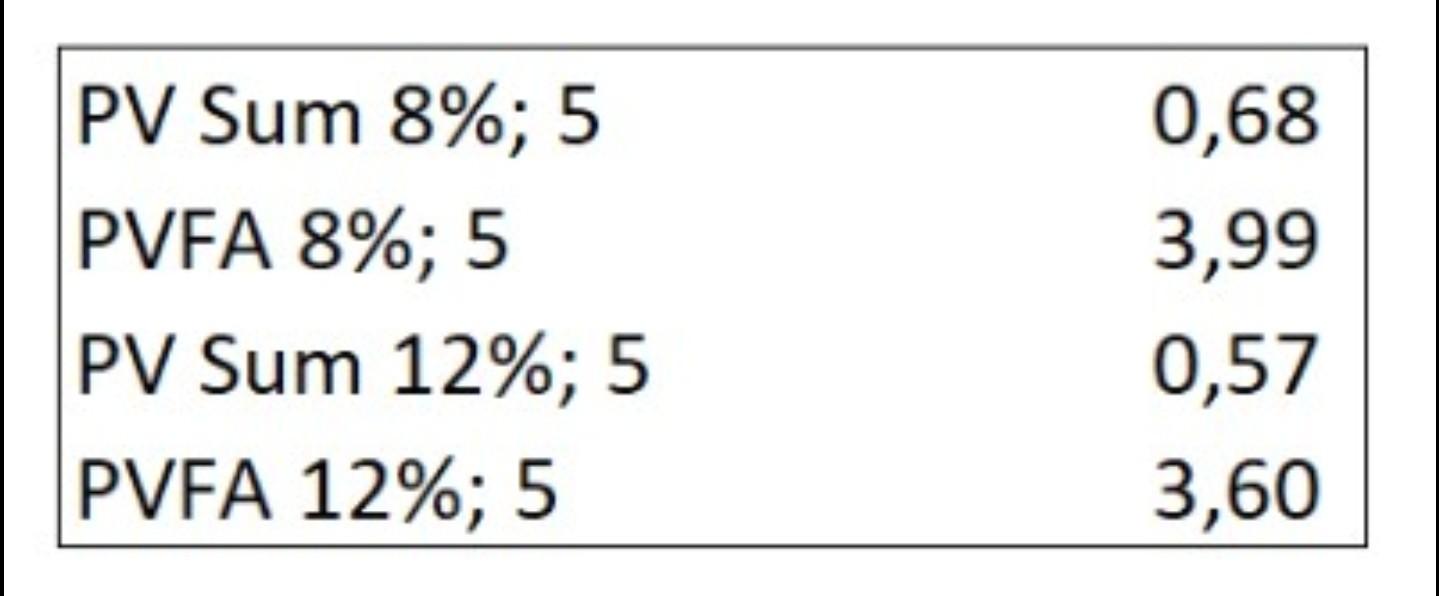
instructions 1. Determine and explain briefly the proper measurement method for debt instrument owned by PT Rent (Hint: SPPI Test and Business Model Test) 2. Make required journal entries that must be made by PT Rent at initial recognition and necessary adjusting entries on December 31, 2022. 3. Assume that in 2020, PT Birdy credit rating was downgraded by Pefindo because the operational business of the company is not well enough to generate cash flow. The rating was downgraded from BB to B so it was concluded that PT Birdy had experienced an increase in credit risk. The table below shows various scenarios relating to probabilities of default for companies with similar credit rating: *Based on the economic teams research, the probability of the above economic conditions occurring (B:N:R) is 30:60:10.
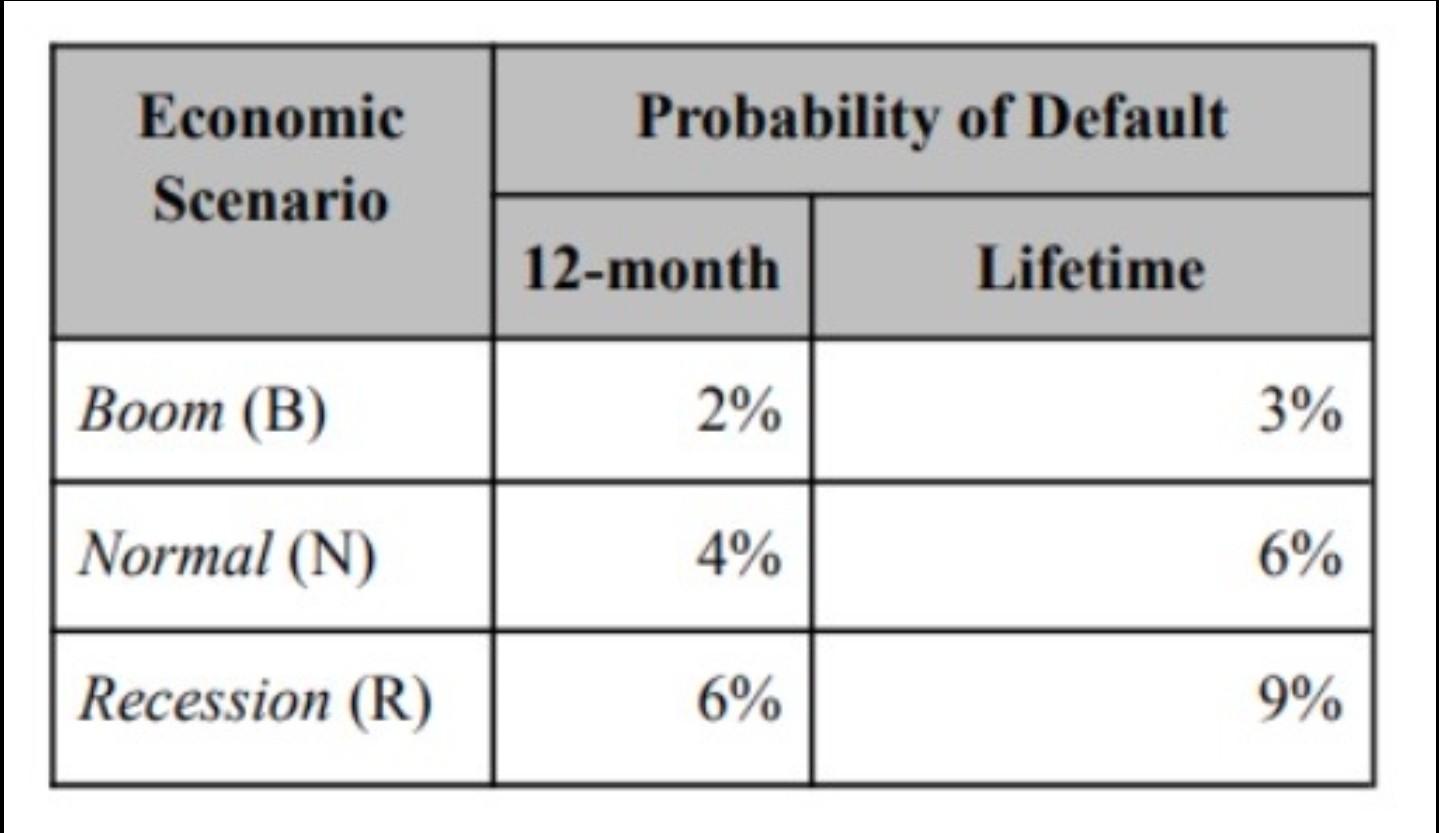
\begin{tabular}{|ll|} \hline PV Sum 8\%; 5 & 0,68 \\ PVFA 8\%; 5 & 3,99 \\ PV Sum 12\%; 5 & 0,57 \\ PVFA 12\%; 5 & 3,60 \\ \hline \end{tabular} \begin{tabular}{|l|r|r|} \hline \multirow{2}{*}{\begin{tabular}{c} Economic \\ Scenario \end{tabular}} & \multicolumn{2}{|c|}{ Probability of Default } \\ \cline { 2 - 3 } & 12-month & \multicolumn{2}{|c|}{ Lifetime } \\ \hline Boom (B) & 2% & 3% \\ \hline Normal (N) & 4% & 6% \\ \hline Recession (R) & 6% & 9% \\ \hline \end{tabular}
Step by Step Solution
There are 3 Steps involved in it
Step: 1

Get Instant Access to Expert-Tailored Solutions
See step-by-step solutions with expert insights and AI powered tools for academic success
Step: 2

Step: 3
Ace Your Homework with AI
Get the answers you need in no time with our AI-driven, step-by-step assistance
Get Started
Management Accounting Text Problems And Cases
Authors: M. Y. Khan, P K Jain
7th Edition
9352606787, 978-9352606788