In 2024 (Year 5), Chips decided to enter the catering business and opened it in Salt Lake City on July 1, 2024. It ended up with $200,000 of equity investment, and the same investors for the cookie business invested the money for the catering business. Their expected return for this business is also 15%. 20,000 shares of the stock were issued at the price of $10 per share. The catering business started slowly in 2024 but picked up as the year went on but finished with a net loss for the 6 months. Also in 2024, the cookie business issued its first dividend, paying out 75% of its year-end retained earnings balance.
Continue to use a 25% tax rate.
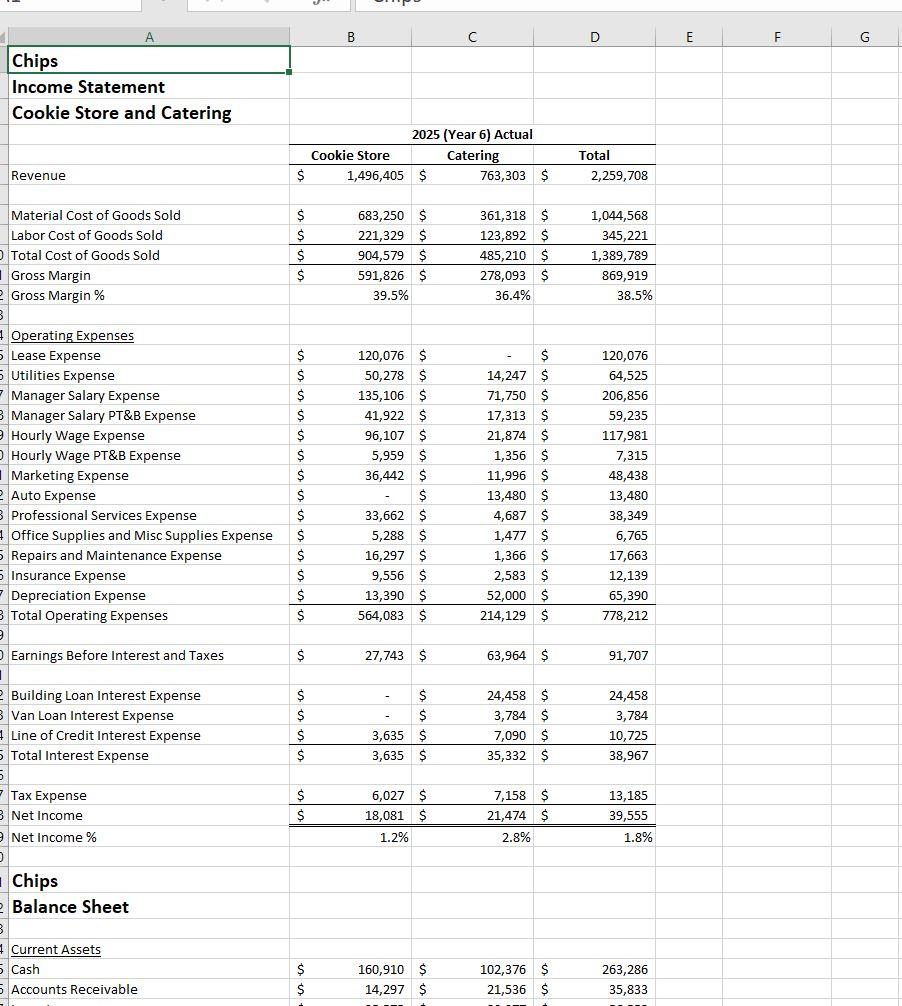
The 2025 (Year 6) results include Chips' cookie store results and the first full year of the catering business. It also includes the combined total. The different segments of the business will be called "Cookie Store" and "Catering."
With a full year of business completed for the catering segment, the CFO would like to compare the 2 segments and the total of both sides by side. Please prepare a report for the board by providing answers and analysis to the items addressed in the Chips (Year 6) assignment document found above.
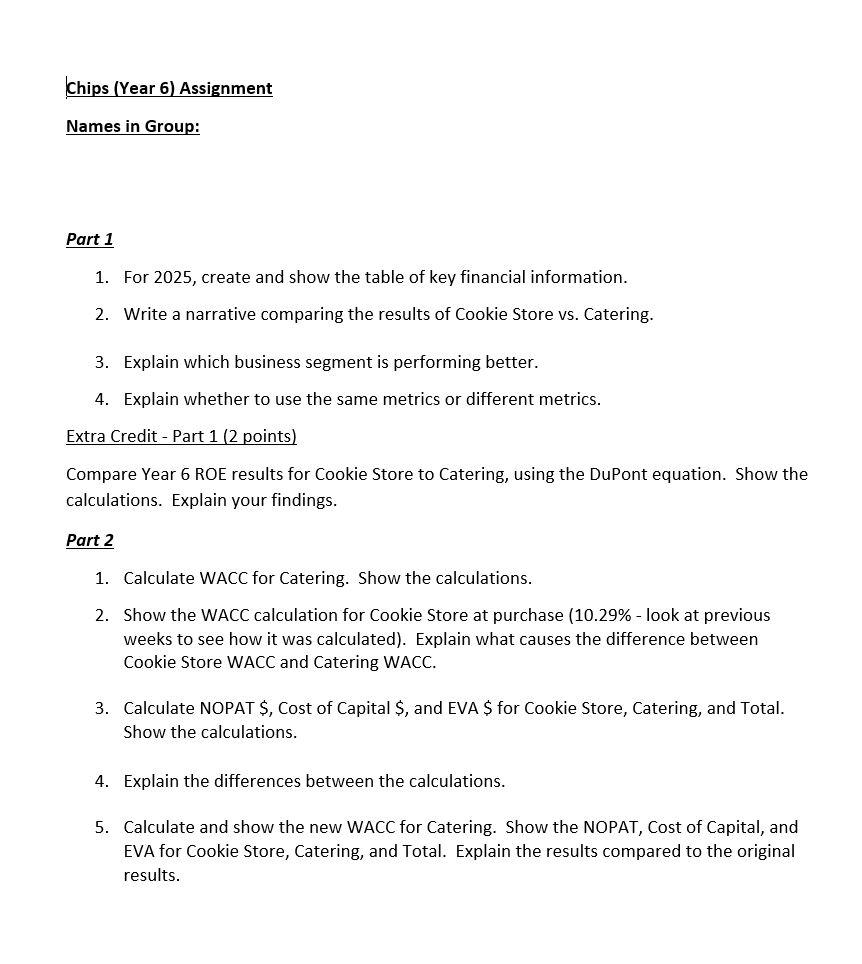
Part 1
- For 2025, create a table that shows the following labels: for Cookie Store, Catering, and Total:
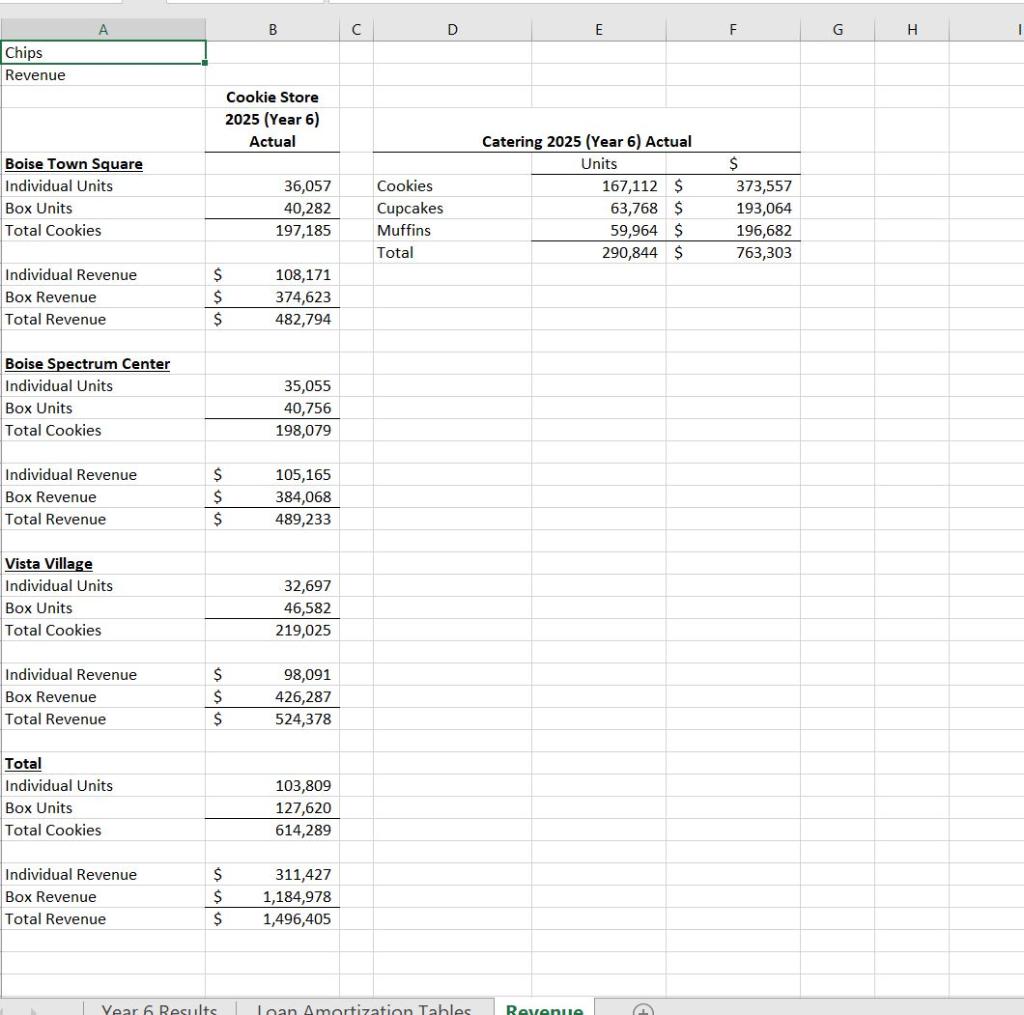
- Revenue $.
- Gross Margin $.
- Gross Margin %.
- Total Operating Expense $.
- Total Operating Expense as % of Revenue.
- Net Income $.
- Net Income %.
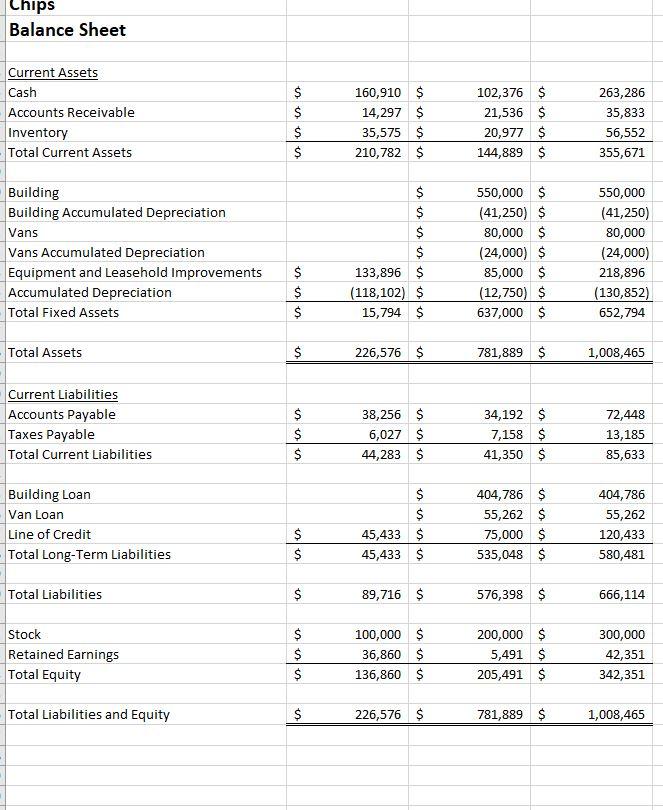
- Leverage Ratio (Assets / Equity).
- Debt/Equity Ratio.
- Debt as % of Total Capital.
- Return on Assets (ROA).
- Return on Equity (ROE).
- Return on Invested Capital (ROIC).
- Write a narrative. Instead of comparing results to the prior year, compare the results of Cookie Store vs. Catering. In the narrative, use the information from question #1 to assist in your writing. Explain why the numbers are different between the two business segments (Cookie Store and Catering). Make sure to go into the details. Break the narrative into the following sections: Summary (include Net Profit), Revenue, Gross Margin, Operating Expenses, and Cash Flows/Balance Sheet. In the "Cash Flows/Balance Sheet" section, be sure to include a discussion of the various ratios calculated that involve the balance sheet. Why were the ratios different for the different business segments? Using a common-size income statement could be helpful for making comparisons between businesses of different sizes.
- Which segment do you think is performing better? Why, and by which metrics?
- Should both business segments use the same metrics to measure their success? Why or why not?
Extra CreditPart 1 (2 points)
Compare Year 6 ROE results for Cookie Store to Catering, using the DuPont equation. Using the components of the equation, what was the cause, or causes of the difference?
Part 2
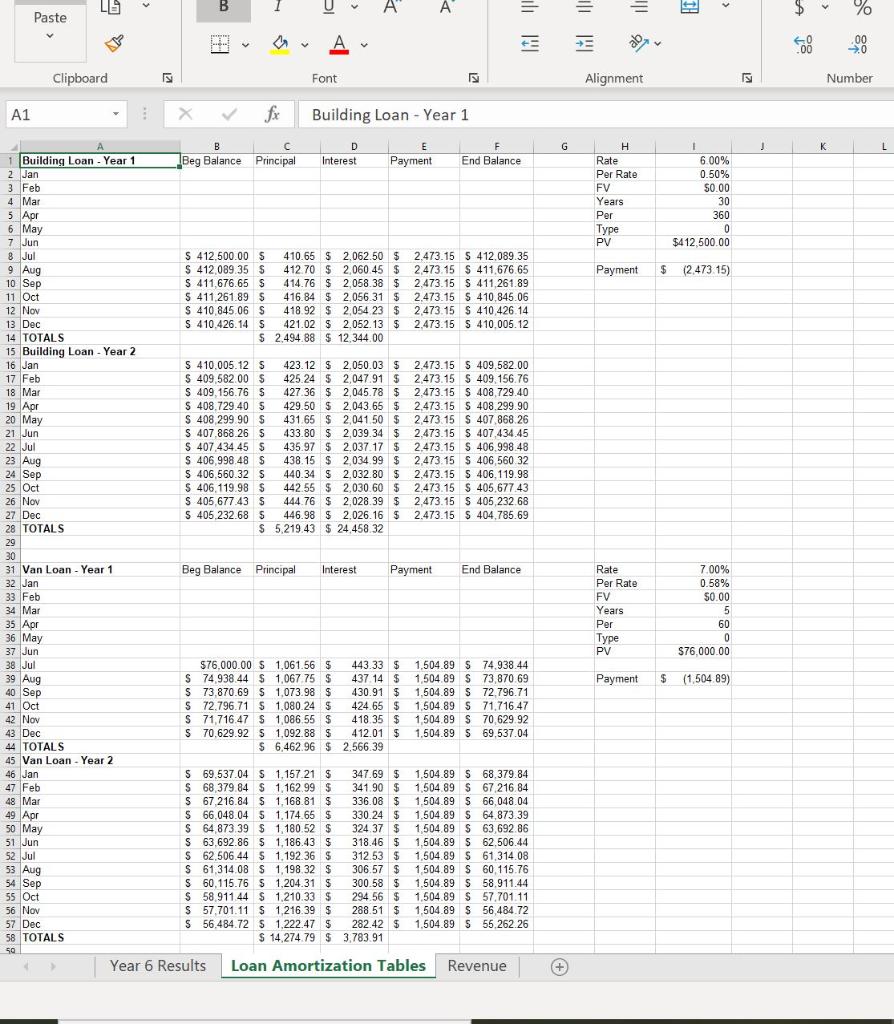
- Calculate WACC for Catering based on the following capital information at the commencement of business:
- Building Loan of $412,500 at 6%.
- Van Loan of $76,000 at 7%.
- Line of Credit Loan of $75,000 at 9%.
- Equity Investment of $200,000 with an expected return of 15%.
- Compare the calculated WACC for Catering to the calculated WACC for Cookie Store at purchase (10.29%look at previous weeks to see how it was calculated). Analyze and explain the difference between the 2 WACCs, including why they are different.
- For 2025, calculate NOPAT $, cost of capital $, and EVA $ for Cookie Store, Catering, and Total. Use the WACC from Part 2 Questions 1 and 2, to do the calculations on the 2025 financial statements (use 2025 capital for your calculations).
- Compare and analyze the NOPAT $, cost of capital $, and EVA $ for Cookie Store, Catering, and Total. What causes the differences?
- Do some "what-if" analysis on our capital structure. For the Catering business, suppose we were able to do a leveraged recapitalizationget an additional $100,000 on our line of credit and use that to re-purchase $100,000 of the equity investment, reducing our stock. Using the WACC calculated in Part 2 Question 1, what would be the new WACC percentage? For Cookie Store, Catering, and Total, recalculate the cost of capital $, and EVA $. Summarize in bullet points the change from the previous calculation of cost of capital $, and EVA $.
Chips Income Statement Cookie Store and Catering Revenue Material Cost of Goods Sold Labor Cost of Goods Sold O Total Cost of Goods Sold Gross Margin 2 Gross Margin% Operating Expenses 5 Lease Expense 5 Utilities Expense 7 Manager Salary Expense 3 Manager Salary PT&B Expense 9 Hourly Wage Expense Hourly Wage PT&B Expense Marketing Expense 2 Auto Expense 3 Professional Services Expense 4 Office Supplies and Misc Supplies Expense 5 Repairs and Maintenance Expense 5 Insurance Expense 7 Depreciation Expense 3 Total Operating Expenses 9 O Earnings Before Interest and Taxes 2 Building Loan Interest Expense 3 Van Loan Interest Expense 4 Line of Credit Interest Expense 5 Total Interest Expense Tax Expense 3 Net Income 9 Net Income % Chips Balance Sheet 1 Current Assets 5 Cash 5 Accounts Receivable $ $ $ $ $ $ $ $ $ $ $ $ $ $ $ $ $ $ $ $ $ $ $ $ B Cookie Store 1,496,405 2025 (Year 6) Actual Catering $ 683,250 $ 221,329 $ 904,579 $ 591,826 $ 39.5% 120,076 $ 50,278 $ 135,106 $ 41,922 $ 96,107 $ 5,959 36,442 $ $ 33,662 $ 5,288 $ 16,297 $ 9,556 $ 13,390 564,083 $ 27,743 $ - $ $ $ 3,635 3,635 $ 6,027 $ 18,081 $ 1.2% 160,910 $ 14,297 $ 763,303 $ 361,318 $ 123,892 $ 485,210 $ 278,093 36.4% 14,247 71,750 $ 17,313 $ 21,874 $ 1,356 11,996 $ $ $ 13,480 S 4,687 $ 1,477 $ 1,366 $ 2,583 $ 52,000 214,129 63,964 $ 24,458 $ 3,784 $ 7,090 35,332 $ 7,158 21,474 2.8% $ $ 102,376 $ 21,536 $ D Total 2,259,708 1,044,568 345,221 1,389,789 869,919 38.5% 120,076 64,525 206,856 59,235 117,981 7,315 48,438 13,480 38,349 6,765 17,663 12,139 65,390 778,212 91,707 24,458 3,784 10,725 38,967 13,185 39,555 1.8% 263,286 35,833 E F G Chips Balance Sheet Current Assets Cash Accounts Receivable Inventory Total Current Assets Building Building Accumulated Depreciation Vans Vans Accumulated Depreciation Equipment and Leasehold Improvements Accumulated Depreciation Total Fixed Assets Total Assets Current Liabilities Accounts Payable Taxes Payable Total Current Liabilities Building Loan Van Loan Line of Credit Total Long-Term Liabilities Total Liabilities Stock Retained Earnings Total Equity Total Liabilities and Equity is sssss $ $ $ $ $ $ $ $ $ esssss $ $ $ is les $ $ es $ esssss $ $ $ is 160,910 $ 14,297 $ 35,575 $ $ 210,782 $ es es $ $ $ 133,896 $ (118,102) $ 15,794 $ 226,576 $ 44,283 38,256 $ 6,027 $ $ $ es is ess $ 45,433 45,433 $ $ 89,716 $ 100,000 $ 36,860 $ 136,860 $ 226,576 $ 102,376 $ 21,536 $ 20,977 $ 144,889 $ 550,000 $ (41,250) $ 80,000 $ (24,000) $ 85,000 $ (12,750) $ 637,000 $ 781,889 $ 34,192 $ 7,158 $ 41,350 $ 404,786 $ 55,262 $ 75,000 $ 535,048 $ 576,398 $ 200,000 $ 5,491 $ 205,491 $ 781,889 $ 263,286 35,833 56,552 355,671 550,000 (41,250) 80,000 (24,000) 218,896 (130,852) 652,794 1,008,465 72,448 13,185 85,633 404,786 55,262 120,433 580,481 666,114 300,000 42,351 342,351 1,008,465 A1 Paste 1 Building Loan - Year 1 2 Jan 3 Feb 4 Mar 5 Apr 6 May 7 Jun 8 Jul 9 Aug 10 Sep 11 Oct 12 Nov 19 Apr 20 May 21 Jun 13 Dec 14 TOTALS 15 Building Loan - Year 2 16 Jan 17 Feb 18 Mar 22 Jul 23 Aug 24 Sep 25 Oct 26 Nov 27 Dec 28 TOTALS 29 Clipboard 32 Jan 33 Feb 34 Mar 35 Apr 36 May 30 31 Van Loan - Year 1 37 Jun 38 Jul 39 Aug 40 Sep 41 Oct LE 42 Nov 43 Dec 44 TOTALS 4 45 Van Loan - Year 2 46 Jan 47 Feb 48 Mar 49 Apr 50 May 51 Jun 52 Jul 53 Aug 54 Sep 55 Oct 56 Nov 57 Dec 58 TOTALS 50 > 1 S B H B Beg Balance Principal $ $ S S $ fx S 410,005.12 S $ 409,582.00 $ S 409,156.76 $ S 408.729.40 S S 408,299.90 S S 407,868.26 $ S 407,434.45 S S 406.998.48 $ $ 406,560.32 $ $ 406,119.98 S S 405,677.43 $ S 405,232.68 $ $ $ S S 412.500.00 $ 410.65 $ 412,089.35 $ S 411,676.65 S $ 411,261.89 $ $ 410,845.06 $ S 410.426.14 S $ Year 6 Results 73,870.69 $ 72.796.71 $ 71,716.47 $ U A A Font 70,629.92 $ $ Beg Balance Principal Interest Building Loan - Year 1 D Interest $76,000.00 $ 1,061.56 $ 74,938.44 $ 1,067.75 S $2,062.50 $ 412.70 $2,060.45 $ 414.76 $2,058.38 $ 416.84 2,056.31 $ 418.92 $2,054.23 $ 421.02 $2.052.13 $ 2,494.88 $ 12,344.00 V 1,073.98 S 1,080.24 S 1,086.55 $ 1,092.88 S 6,462.96 $ 423.12 $2,050.03 $ 2.473.15 $ 409.582.00 425.24 S 2,047.91 $ 2,473.15 S 409,156.76 427.36 $2,045.78 $ 2,473.15 S 408,729.40 429.50 $2,043.65 $ 2,473.15 S 408.299.90 431.65 $2,041.50 $ 2,473.15 S 407,868.26 433.80 $2,039.34 $ 2,473.15 S 407,434.45 435.97 $2,037.17 $2.473.15 S 406,998.48 438.15 $2,034.99 $2,473.15 S 406,560.32 440.34 $2,032.80 $2,473.15 S 406,119.98 442.55 $ 2,030.60 $2,473.15 S 405.677.43 444.76 $2,028.39 $ 2,473.15 S 405,232.68 446.98 $2.026.16 $ 2.473.15 S 404,785.69 5,219.43 $ 24,458.32 2,566.39 S 69.537.04 S 1.157.21 S $ 68,379.84 S 1,162.99 $ S 67,216.84 $ 1,168.81 $ $ 66,048.04 $ 1,174.65 $ 1,180.52 $ 64,873.39 $ 63,692.86 $ 1,186.43 $ S 62,506.44 $ 1.192.36 $ 1,198.32 $ S 61,314.08 S S 60,115.76 $ 1,204.31 $ $ 58,911.44 $ 1.210.33 S S 57,701.11 $1,216.39 $ S 56,484.72 $ 1,222.47 $ $ 14,274.79 $ 3,783.91 A 443.33 $ 437.14 $ 430.91 $ 424.65 $ 418.35 $ 412.01 $ S E F Payment End Balance 347.69 $ 341.90 $ 336.08 $ 330.24 $ 324.37 $ 318.46 $ 312.53 $ 306.57 $ 300.58 $ 294.56 $ 288.51 $ 282.42 $ th E Payment End Balance 2.473.15 S 412,089.35 2.473.15 S 411.676.65 2,473.15 S 411,261.89 2.473.15 $ 410,845.06 S 2,473.15 S 410,426.14 2,473.15 S 410,005.12 1,504.89 $ 74,938.44 1,504.89 $ 73,870.69 1,504.89 $ 72,796.71 1,504.89 S 71.716.47 70,629.92 1,504.89 $ 1,504.89 $ 69,537.04 Loan Amortization Tables Revenue 1,504.89 $ 68,379.84 1.504.89 $ 67,216.84 1.504.89 $ 66,048.04 1.504.89 $ 64,873.39 1,504.89 $ 63,692.86 1,504.89 $ 62,506.44 1,504.89 $ 61,314.08 1,504.89 $ 60,115.76 1,504.89 $ 58,911.44 1.504.89 $ 57,701.11 1,504.89 $ 56,484.72 1,504.89 $ 55,262.26 G (+ Alignment H Rate Per Rate FV Years Per Type PV Payment Rate Per Rate FV Years Per Type PV HI 1 > 6.00% 0.50% $0.00 30 360 0 $412,500.00 $ (2.473.15) 7.00% 0.58% $0.00 5 60 0 $76,000.00 Payment $ (1,504.89) 12 J $ 00 % -0000 Number K L Chips Revenue A Boise Town Square Individual Units Box Units Total Cookies Individual Revenue Box Revenue Total Revenue Boise Spectrum Center Individual Units Box Units Total Cookies Individual Revenue Box Revenue Total Revenue Vista Village Individual Units Box Units Total Cookies Individual Revenue Box Revenue Total Revenue Total Individual Units Box Units Total Cookies Individual Revenue Box Revenue Total Revenue $ $ $ $ $ $ $ $ $ Cookie Store 2025 (Year 6) Actual $ $ $ Year 6 Results B 36,057 40,282 197,185 108,171 374,623 482,794 35,055 40,756 198,079 105,165 384,068 489,233 32,697 46,582 219,025 98,091 426,287 524,378 103,809 127,620 614,289 311,427 1,184,978 1,496,405 C Cookies Cupcakes Muffins Total D E Catering 2025 (Year 6) Actual Units Loan Amortization Tables Revenue 167,112 $ 63,768 $ 59,964 $ 290,844 $ O F $ 373,557 193,064 196,682 763,303 G H Chips (Year 6) Assignment Names in Group: Part 1 1. For 2025, create and show the table of key financial information. 2. Write a narrative comparing the results of Cookie Store vs. Catering. 3. Explain which business segment is performing better. 4. Explain whether to use the same metrics or different metrics. Extra Credit - Part 1 (2 points) Compare Year 6 ROE results for Cookie Store to Catering, using the DuPont equation. Show the calculations. Explain your findings. Part 2 1. Calculate WACC for Catering. Show the calculations. 2. Show the WACC calculation for Cookie Store at purchase (10.29% - look at previous weeks to see how it was calculated). Explain what causes the difference between Cookie Store WACC and Catering WACC. 3. Calculate NOPAT $, Cost of Capital $, and EVA $ for Cookie Store, Catering, and Total. Show the calculations. 4. Explain the differences between the calculations. 5. Calculate and show the new WACC for Catering. Show the NOPAT, Cost of Capital, and EVA for Cookie Store, Catering, and Total. Explain the results compared to the original results. Chips Income Statement Cookie Store and Catering Revenue Material Cost of Goods Sold Labor Cost of Goods Sold O Total Cost of Goods Sold Gross Margin 2 Gross Margin% Operating Expenses 5 Lease Expense 5 Utilities Expense 7 Manager Salary Expense 3 Manager Salary PT&B Expense 9 Hourly Wage Expense Hourly Wage PT&B Expense Marketing Expense 2 Auto Expense 3 Professional Services Expense 4 Office Supplies and Misc Supplies Expense 5 Repairs and Maintenance Expense 5 Insurance Expense 7 Depreciation Expense 3 Total Operating Expenses 9 O Earnings Before Interest and Taxes 2 Building Loan Interest Expense 3 Van Loan Interest Expense 4 Line of Credit Interest Expense 5 Total Interest Expense Tax Expense 3 Net Income 9 Net Income % Chips Balance Sheet 1 Current Assets 5 Cash 5 Accounts Receivable $ $ $ $ $ $ $ $ $ $ $ $ $ $ $ $ $ $ $ $ $ $ $ $ B Cookie Store 1,496,405 2025 (Year 6) Actual Catering $ 683,250 $ 221,329 $ 904,579 $ 591,826 $ 39.5% 120,076 $ 50,278 $ 135,106 $ 41,922 $ 96,107 $ 5,959 36,442 $ $ 33,662 $ 5,288 $ 16,297 $ 9,556 $ 13,390 564,083 $ 27,743 $ - $ $ $ 3,635 3,635 $ 6,027 $ 18,081 $ 1.2% 160,910 $ 14,297 $ 763,303 $ 361,318 $ 123,892 $ 485,210 $ 278,093 36.4% 14,247 71,750 $ 17,313 $ 21,874 $ 1,356 11,996 $ $ $ 13,480 S 4,687 $ 1,477 $ 1,366 $ 2,583 $ 52,000 214,129 63,964 $ 24,458 $ 3,784 $ 7,090 35,332 $ 7,158 21,474 2.8% $ $ 102,376 $ 21,536 $ D Total 2,259,708 1,044,568 345,221 1,389,789 869,919 38.5% 120,076 64,525 206,856 59,235 117,981 7,315 48,438 13,480 38,349 6,765 17,663 12,139 65,390 778,212 91,707 24,458 3,784 10,725 38,967 13,185 39,555 1.8% 263,286 35,833 E F G Chips Balance Sheet Current Assets Cash Accounts Receivable Inventory Total Current Assets Building Building Accumulated Depreciation Vans Vans Accumulated Depreciation Equipment and Leasehold Improvements Accumulated Depreciation Total Fixed Assets Total Assets Current Liabilities Accounts Payable Taxes Payable Total Current Liabilities Building Loan Van Loan Line of Credit Total Long-Term Liabilities Total Liabilities Stock Retained Earnings Total Equity Total Liabilities and Equity is sssss $ $ $ $ $ $ $ $ $ esssss $ $ $ is les $ $ es $ esssss $ $ $ is 160,910 $ 14,297 $ 35,575 $ $ 210,782 $ es es $ $ $ 133,896 $ (118,102) $ 15,794 $ 226,576 $ 44,283 38,256 $ 6,027 $ $ $ es is ess $ 45,433 45,433 $ $ 89,716 $ 100,000 $ 36,860 $ 136,860 $ 226,576 $ 102,376 $ 21,536 $ 20,977 $ 144,889 $ 550,000 $ (41,250) $ 80,000 $ (24,000) $ 85,000 $ (12,750) $ 637,000 $ 781,889 $ 34,192 $ 7,158 $ 41,350 $ 404,786 $ 55,262 $ 75,000 $ 535,048 $ 576,398 $ 200,000 $ 5,491 $ 205,491 $ 781,889 $ 263,286 35,833 56,552 355,671 550,000 (41,250) 80,000 (24,000) 218,896 (130,852) 652,794 1,008,465 72,448 13,185 85,633 404,786 55,262 120,433 580,481 666,114 300,000 42,351 342,351 1,008,465 A1 Paste 1 Building Loan - Year 1 2 Jan 3 Feb 4 Mar 5 Apr 6 May 7 Jun 8 Jul 9 Aug 10 Sep 11 Oct 12 Nov 19 Apr 20 May 21 Jun 13 Dec 14 TOTALS 15 Building Loan - Year 2 16 Jan 17 Feb 18 Mar 22 Jul 23 Aug 24 Sep 25 Oct 26 Nov 27 Dec 28 TOTALS 29 Clipboard 32 Jan 33 Feb 34 Mar 35 Apr 36 May 30 31 Van Loan - Year 1 37 Jun 38 Jul 39 Aug 40 Sep 41 Oct LE 42 Nov 43 Dec 44 TOTALS 4 45 Van Loan - Year 2 46 Jan 47 Feb 48 Mar 49 Apr 50 May 51 Jun 52 Jul 53 Aug 54 Sep 55 Oct 56 Nov 57 Dec 58 TOTALS 50 > 1 S B H B Beg Balance Principal $ $ S S $ fx S 410,005.12 S $ 409,582.00 $ S 409,156.76 $ S 408.729.40 S S 408,299.90 S S 407,868.26 $ S 407,434.45 S S 406.998.48 $ $ 406,560.32 $ $ 406,119.98 S S 405,677.43 $ S 405,232.68 $ $ $ S S 412.500.00 $ 410.65 $ 412,089.35 $ S 411,676.65 S $ 411,261.89 $ $ 410,845.06 $ S 410.426.14 S $ Year 6 Results 73,870.69 $ 72.796.71 $ 71,716.47 $ U A A Font 70,629.92 $ $ Beg Balance Principal Interest Building Loan - Year 1 D Interest $76,000.00 $ 1,061.56 $ 74,938.44 $ 1,067.75 S $2,062.50 $ 412.70 $2,060.45 $ 414.76 $2,058.38 $ 416.84 2,056.31 $ 418.92 $2,054.23 $ 421.02 $2.052.13 $ 2,494.88 $ 12,344.00 V 1,073.98 S 1,080.24 S 1,086.55 $ 1,092.88 S 6,462.96 $ 423.12 $2,050.03 $ 2.473.15 $ 409.582.00 425.24 S 2,047.91 $ 2,473.15 S 409,156.76 427.36 $2,045.78 $ 2,473.15 S 408,729.40 429.50 $2,043.65 $ 2,473.15 S 408.299.90 431.65 $2,041.50 $ 2,473.15 S 407,868.26 433.80 $2,039.34 $ 2,473.15 S 407,434.45 435.97 $2,037.17 $2.473.15 S 406,998.48 438.15 $2,034.99 $2,473.15 S 406,560.32 440.34 $2,032.80 $2,473.15 S 406,119.98 442.55 $ 2,030.60 $2,473.15 S 405.677.43 444.76 $2,028.39 $ 2,473.15 S 405,232.68 446.98 $2.026.16 $ 2.473.15 S 404,785.69 5,219.43 $ 24,458.32 2,566.39 S 69.537.04 S 1.157.21 S $ 68,379.84 S 1,162.99 $ S 67,216.84 $ 1,168.81 $ $ 66,048.04 $ 1,174.65 $ 1,180.52 $ 64,873.39 $ 63,692.86 $ 1,186.43 $ S 62,506.44 $ 1.192.36 $ 1,198.32 $ S 61,314.08 S S 60,115.76 $ 1,204.31 $ $ 58,911.44 $ 1.210.33 S S 57,701.11 $1,216.39 $ S 56,484.72 $ 1,222.47 $ $ 14,274.79 $ 3,783.91 A 443.33 $ 437.14 $ 430.91 $ 424.65 $ 418.35 $ 412.01 $ S E F Payment End Balance 347.69 $ 341.90 $ 336.08 $ 330.24 $ 324.37 $ 318.46 $ 312.53 $ 306.57 $ 300.58 $ 294.56 $ 288.51 $ 282.42 $ th E Payment End Balance 2.473.15 S 412,089.35 2.473.15 S 411.676.65 2,473.15 S 411,261.89 2.473.15 $ 410,845.06 S 2,473.15 S 410,426.14 2,473.15 S 410,005.12 1,504.89 $ 74,938.44 1,504.89 $ 73,870.69 1,504.89 $ 72,796.71 1,504.89 S 71.716.47 70,629.92 1,504.89 $ 1,504.89 $ 69,537.04 Loan Amortization Tables Revenue 1,504.89 $ 68,379.84 1.504.89 $ 67,216.84 1.504.89 $ 66,048.04 1.504.89 $ 64,873.39 1,504.89 $ 63,692.86 1,504.89 $ 62,506.44 1,504.89 $ 61,314.08 1,504.89 $ 60,115.76 1,504.89 $ 58,911.44 1.504.89 $ 57,701.11 1,504.89 $ 56,484.72 1,504.89 $ 55,262.26 G (+ Alignment H Rate Per Rate FV Years Per Type PV Payment Rate Per Rate FV Years Per Type PV HI 1 > 6.00% 0.50% $0.00 30 360 0 $412,500.00 $ (2.473.15) 7.00% 0.58% $0.00 5 60 0 $76,000.00 Payment $ (1,504.89) 12 J $ 00 % -0000 Number K L Chips Revenue A Boise Town Square Individual Units Box Units Total Cookies Individual Revenue Box Revenue Total Revenue Boise Spectrum Center Individual Units Box Units Total Cookies Individual Revenue Box Revenue Total Revenue Vista Village Individual Units Box Units Total Cookies Individual Revenue Box Revenue Total Revenue Total Individual Units Box Units Total Cookies Individual Revenue Box Revenue Total Revenue $ $ $ $ $ $ $ $ $ Cookie Store 2025 (Year 6) Actual $ $ $ Year 6 Results B 36,057 40,282 197,185 108,171 374,623 482,794 35,055 40,756 198,079 105,165 384,068 489,233 32,697 46,582 219,025 98,091 426,287 524,378 103,809 127,620 614,289 311,427 1,184,978 1,496,405 C Cookies Cupcakes Muffins Total D E Catering 2025 (Year 6) Actual Units Loan Amortization Tables Revenue 167,112 $ 63,768 $ 59,964 $ 290,844 $ O F $ 373,557 193,064 196,682 763,303 G H Chips (Year 6) Assignment Names in Group: Part 1 1. For 2025, create and show the table of key financial information. 2. Write a narrative comparing the results of Cookie Store vs. Catering. 3. Explain which business segment is performing better. 4. Explain whether to use the same metrics or different metrics. Extra Credit - Part 1 (2 points) Compare Year 6 ROE results for Cookie Store to Catering, using the DuPont equation. Show the calculations. Explain your findings. Part 2 1. Calculate WACC for Catering. Show the calculations. 2. Show the WACC calculation for Cookie Store at purchase (10.29% - look at previous weeks to see how it was calculated). Explain what causes the difference between Cookie Store WACC and Catering WACC. 3. Calculate NOPAT $, Cost of Capital $, and EVA $ for Cookie Store, Catering, and Total. Show the calculations. 4. Explain the differences between the calculations. 5. Calculate and show the new WACC for Catering. Show the NOPAT, Cost of Capital, and EVA for Cookie Store, Catering, and Total. Explain the results compared to the original results