Answered step by step
Verified Expert Solution
Question
1 Approved Answer
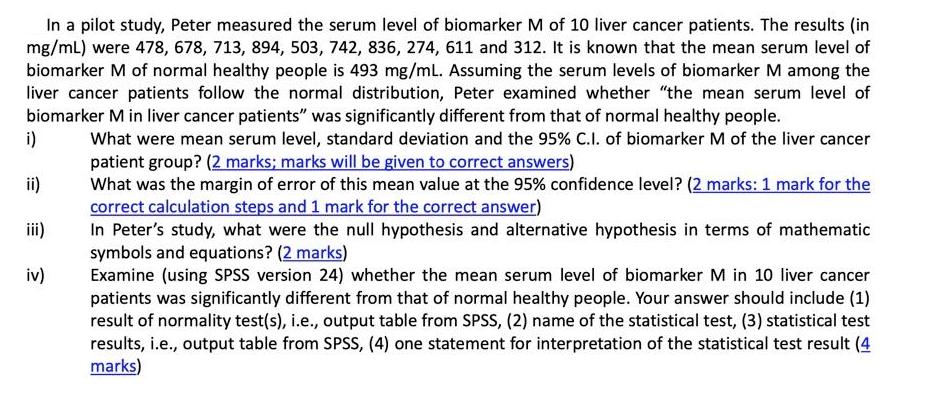
In a pilot study, Peter measured the serum level of biomarker M of 10 liver cancer patients. The results (in mg/mL) were 478, 678,

In a pilot study, Peter measured the serum level of biomarker M of 10 liver cancer patients. The results (in mg/mL) were 478, 678, 713, 894, 503, 742, 836, 274, 611 and 312. It is known that the mean serum level of biomarker M of normal healthy people is 493 mg/ml. Assuming the serum levels of biomarker M among the liver cancer patients follow the normal distribution, Peter examined whether "the mean serum level of biomarker M in liver cancer patients" was significantly different from that of normal healthy people. i) What were mean serum level, standard deviation and the 95% C.I. of biomarker M of the liver cancer patient group? (2 marks; marks will be given to correct answers) What was the margin of error of this mean value at the 95% confidence level? (2 marks: 1 mark for the correct calculation steps and 1 mark for the correct answer) In Peter's study, what were the null hypothesis and alternative hypothesis in terms of mathematic symbols and equations? (2 marks) ii) iii) iv) Examine (using SPSS version 24) whether the mean serum level of biomarker M in 10 liver cancer patients was significantly different from that of normal healthy people. Your answer should include (1) result of normality test(s), i.e., output table from SPSS, (2) name of the statistical test, (3) statistical test results, i.e., output table from SPSS, (4) one statement for interpretation of the statistical test result (4 marks)
Step by Step Solution
★★★★★
3.49 Rating (159 Votes )
There are 3 Steps involved in it
Step: 1
A E F K L M 1 2 let X denote serum level of biomarker Min mgml Hypothesis xxbar Ho 3 Sno X 4 1 478 ...
Get Instant Access to Expert-Tailored Solutions
See step-by-step solutions with expert insights and AI powered tools for academic success
Step: 2

Step: 3

Ace Your Homework with AI
Get the answers you need in no time with our AI-driven, step-by-step assistance
Get Started


