

Question
In a Stroop test, participants are presented with a list of color words, with each word displayed in an ink color. The participant's task is
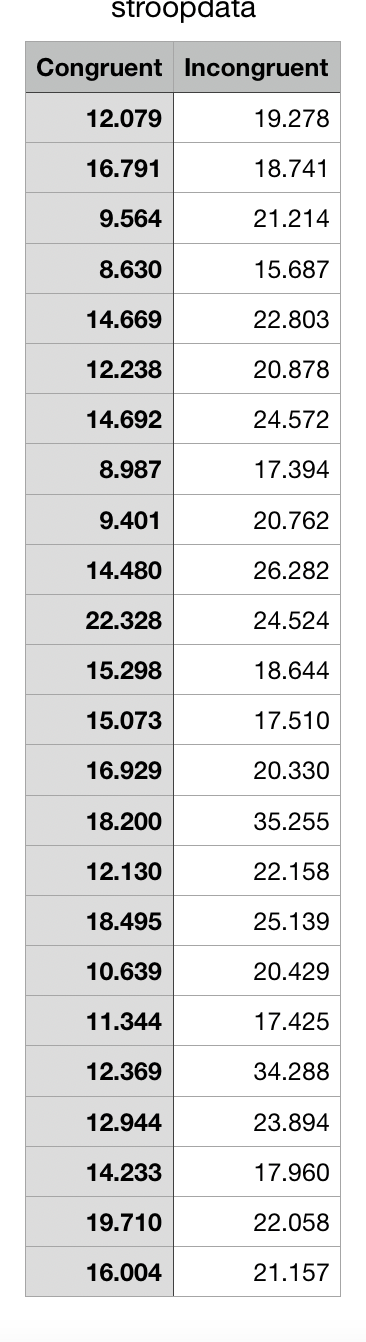
In a Stroop test, participants are presented with a list of color words, with each word displayed in an ink color. The participant's task is to say out loud the ink color in which the word is printed. The task has two conditions: a congruent words condition, and an incongruent words condition. In the congruent condition, the color of the word matches the spelling of the printed word; but in the incongruent condition, the color of the word does not match the spelling of the printed word. Each participant usually participates in both conditions. I have uploaded a Stroop test dataset of 24 participants on eClass, the file name being stroopdata.csv. The dataset shows the time (in seconds) it took for each participant to complete the task in each condition. In this question, you will need to conduct the appropriate t-test for this dataset.
(a) Before doing the hypotheses testing, let's first compute some descriptive statistics and visualize the data using graphs. What are the sample means and sample standard deviation for each of the conditions? Use hist() function to graph the frequency distribution for the sample data in each condition. Which condition generally took the participants longer to complete? Attach the graphs and R code.
(b) Which one is a more appropriate test for this data set, paired sample t-test or independent-samples t-test? Explain.
(c) State the null and alternative hypotheses. Assume that we are doing a directional test.
(d) Compute the t-statistic for our sample data. Show work. Attach R code if used.
(e) Over repeated samples, which distribution does the t-statistic follow assuming H0
is true? (Hint: include the degrees of freedom).
(f) Compute the p-value. Show work and attach R code.
(g) How do you interpret the p-value?
(h) Suppose ? " 0.05. Can you reject the null? What is your conclusion?
(i) Using the same ? level, compute the upper critical t-value. What is the upper critical t-value. Based on the upper critical t-value, can you reject the null? Attach R code.
(j) Use t.test function conduct the t-test. Do you obtain the same p-value? Attach the code.
(k) What is the 95% confidence interval you obtained from t.test? How do you inter- pret this confidence interval?
Step by Step Solution
There are 3 Steps involved in it
Step: 1

Get Instant Access to Expert-Tailored Solutions
See step-by-step solutions with expert insights and AI powered tools for academic success
Step: 2

Step: 3
Ace Your Homework with AI
Get the answers you need in no time with our AI-driven, step-by-step assistance
Get Started
Calculus Early Transcendentals
Authors: Michael Sullivan, Kathleen Miranda
2nd Edition
1319067484, 9781319067489