Answered step by step
Verified Expert Solution
Question
1 Approved Answer
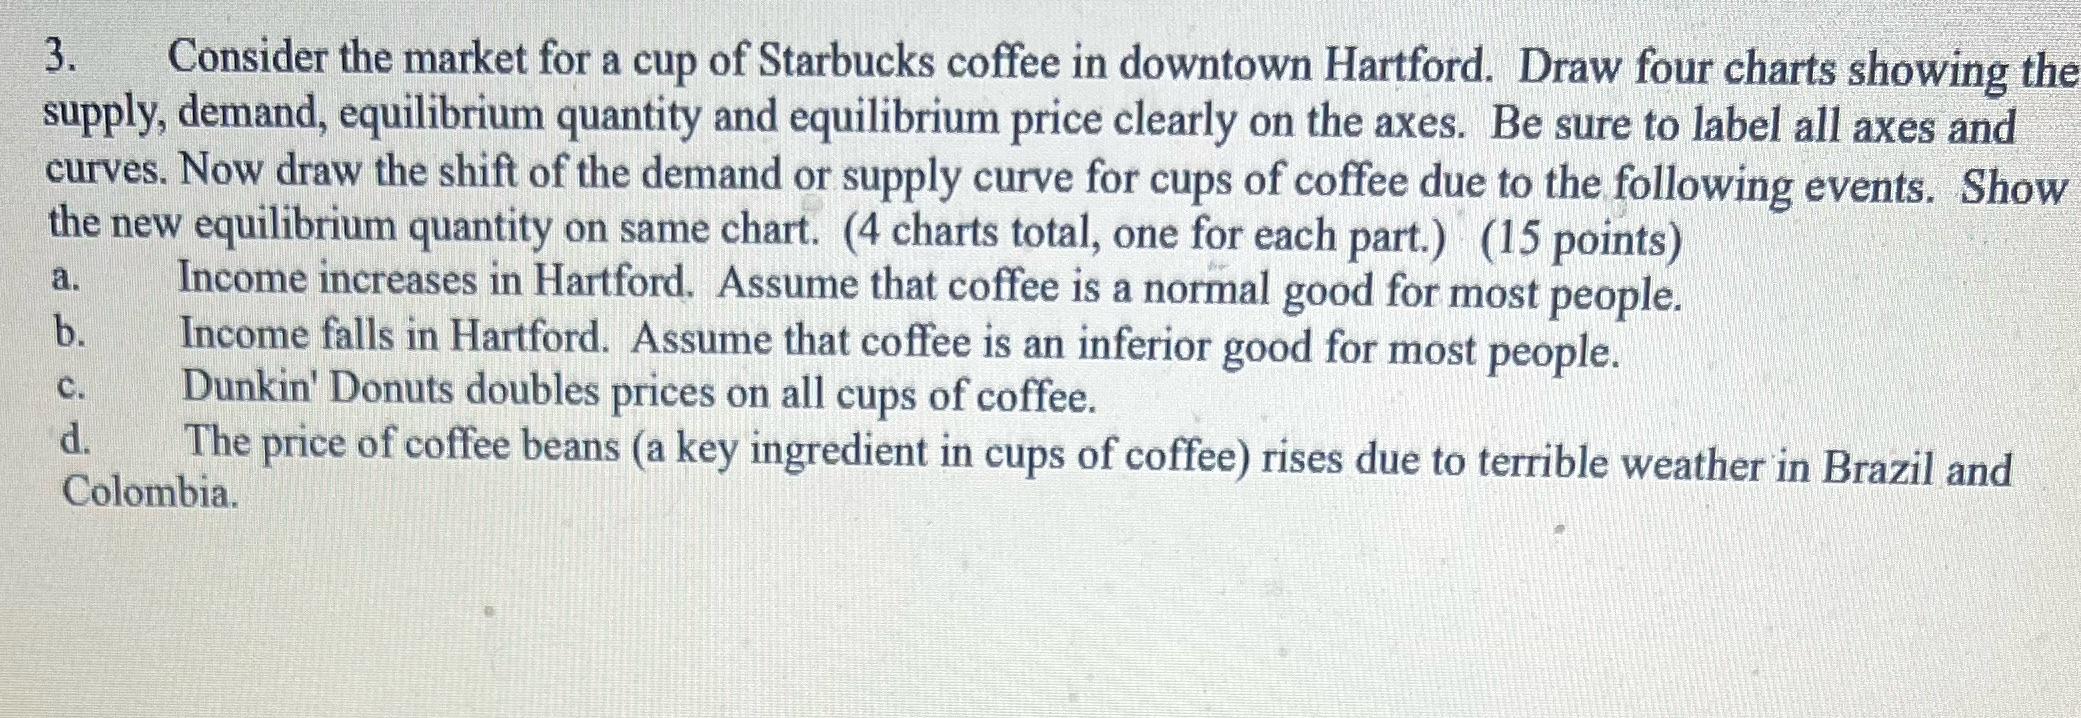
3. Consider the market for a cup of Starbucks coffee in downtown Hartford. Draw four charts showing the supply, demand, equilibrium quantity and equilibrium

3. Consider the market for a cup of Starbucks coffee in downtown Hartford. Draw four charts showing the supply, demand, equilibrium quantity and equilibrium price clearly on the axes. Be sure to label all axes and curves. Now draw the shift of the demand or supply curve for cups of coffee due to the following events. Show the new equilibrium quantity on same chart. (4 charts total, one for each part.) (15 points) a. b. C. d. Income increases in Hartford. Assume that coffee is a normal good for most people. Income falls in Hartford. Assume that coffee is an inferior good for most people. Dunkin' Donuts doubles prices on all cups of coffee. The price of coffee beans (a key ingredient in cups of coffee) rises due to terrible weather in Brazil and Colombia.
Step by Step Solution
There are 3 Steps involved in it
Step: 1
Market for Starbucks Coffee in Downtown Hartford Assumptions Coffee is a normal good except for part b Price P is on the vertical axis Quantity Q is o...
Get Instant Access to Expert-Tailored Solutions
See step-by-step solutions with expert insights and AI powered tools for academic success
Step: 2

Step: 3

Ace Your Homework with AI
Get the answers you need in no time with our AI-driven, step-by-step assistance
Get Started


