Question
In a study of jury behavior, Dr. Marek will obtain two samples of participants and give them details about a trial in which the defendant
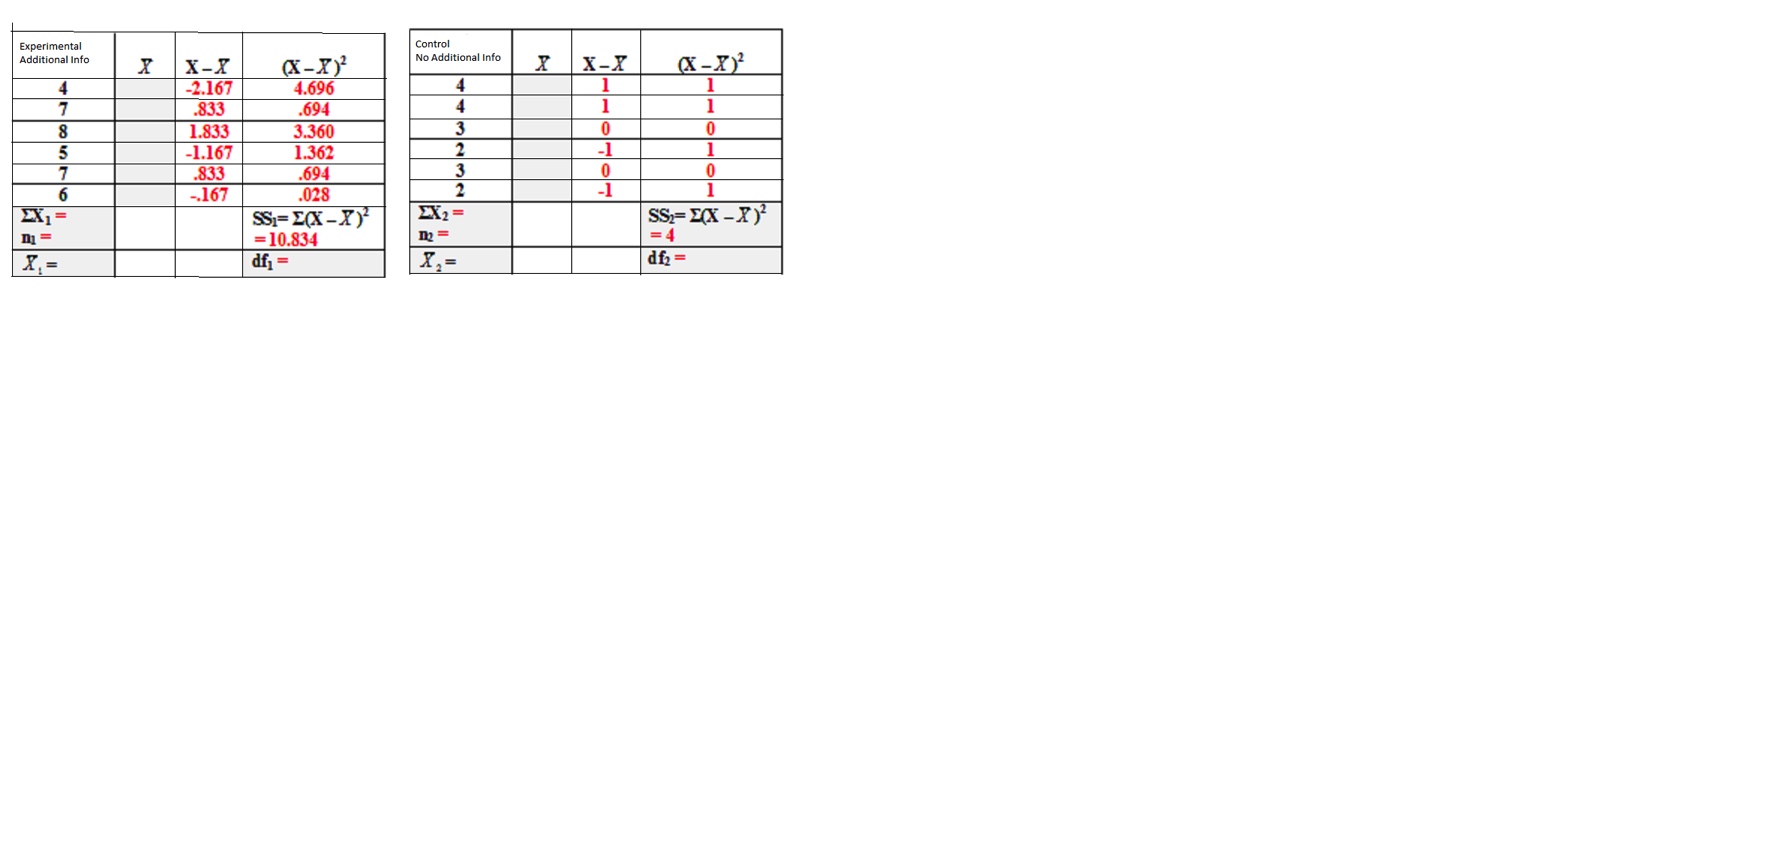
In a study of jury behavior, Dr. Marek will obtain two samples of participants and give them details about a trial in which the defendant was obviously guilty. Although both groups will hear the same details during the trial, one group will be told that the judge withheld some evidence from the jury, while the other will not be told. Later the participants will be asked to recommend a jail sentence. Dr. Marek wants to see if the additional information (knowing that some evidence had been withheld) would affect the recommended sentence. The length of the sentence each participant recommended is presented in years in the chart below.
Set the significance level. ?= .05
Findt-critical. If there is more than onet-critical for this problem, please list the positive one first, then the negative one. If there is only onet-critical for this problem, please typeno second critical valuein the second input box.
It is not necessary to include a positive sign because all numbers are assumed to be positive by default unless a negative sign precedes them.
This chart provides the raw data for6 participants in each of the two conditions. It provides the sum of squares for each group. You must provide the sample size, sum of the raw scores, themean of the raw scores, and the degrees of freedom for each condition in the following 4 questions.
1) Based on the the data in the charts describing Dr. Marek's experiment above, identify the number of participants in the experimental group (the group that received additional information from the judge).
n1=
2) Based on the the data in the charts describing Dr. Marek's experiment above, identify the number of participants in the control group (the group that did not receive additional information from the judge).
n2=
3) In the charts shown in the previous item, Answer using a whole number.
?X1=
4) In the charts shown in the previous item, Answer using a whole number.
?X2=
5) In the chart shown in the previous item, the mean of the first group, X 1 ....look at the chart for the symbol
Round your answer tothree decimal places.
6) In the chart shown in the previous item, the mean score for the second group,X 2 .... look at the chart for the symbol
Please give your answer as awhole number(no decimal places).
7) The pooled variance,
8) The standard error of the difference between the means,
9) t-obtained =

Step by Step Solution
There are 3 Steps involved in it
Step: 1

Get Instant Access to Expert-Tailored Solutions
See step-by-step solutions with expert insights and AI powered tools for academic success
Step: 2

Step: 3

Ace Your Homework with AI
Get the answers you need in no time with our AI-driven, step-by-step assistance
Get Started


