Answered step by step
Verified Expert Solution
Question
1 Approved Answer
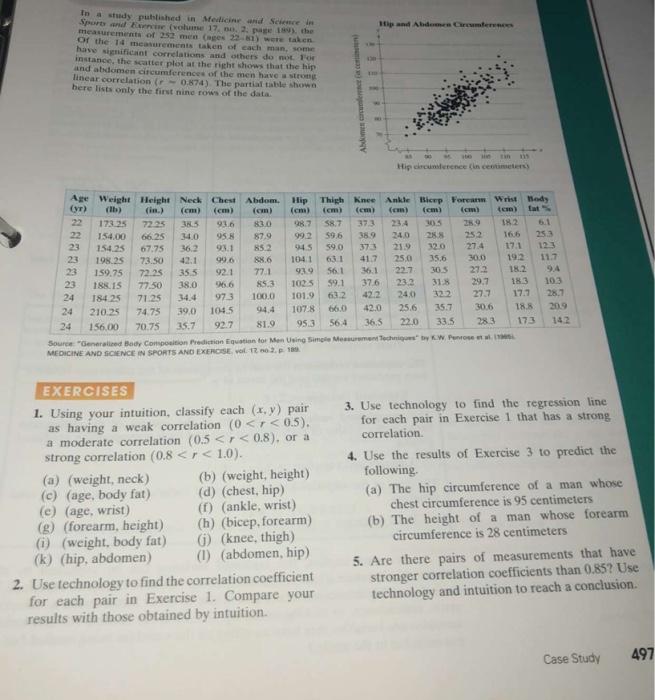
In a study published in Medicine and Science in Sports and Exercise (volume 17, no. 2, page 189), the measurements of 252 men (ages

In a study published in Medicine and Science in Sports and Exercise (volume 17, no. 2, page 189), the measurements of 252 men (ages 22-81) were taken Of the 14 measurements taken of each man, some have significant correlations and others do not. For instance, the scatter plot at the right shows that the hip and abdomen circumferences of the men have a strong linear correlation (-0.874). The partial table shown. bere lists only the first nine rows of the data. Age Weight Height Neck Chest Abdom. (yr) (in.) (cm) (lb) 173.25 72.25 154.00 66.25 154.25 67.75 (cm) (cm) 38.5 93.6 34.0 95.8 36.2 93.1 73.50 42.1 99.6 35.5 92.1 38.0 77.50 96.6 71.25 34.4 97.3 74.75 39,0 70.75 35.7 2222 23 23 198.25 23 23 24 24 24 159.75 72.25 188.15 184.25 210.25 156,00 104.5 92.7 83.0 87.9 85.2 88.6 77.1 (a) (weight, neck) (c) (age, body fat) (e) (age, wrist) (g) (forearm, height) (i) (weight, body fat) (k) (hip, abdomen) 85.3 100.0 94,4 81.9 Hip (cm) 98.7 58.7 99.2 59,6 94.5 59.0 104.1 63.1 93.9 56.1 102.5 59.1 101.9 63.2 107.8 66.0 95.3 56.4 EXERCISES 1. Using your intuition, classify each (x,y) pair as having a weak correlation (0
Step by Step Solution
★★★★★
3.36 Rating (152 Votes )
There are 3 Steps involved in it
Step: 1

Get Instant Access to Expert-Tailored Solutions
See step-by-step solutions with expert insights and AI powered tools for academic success
Step: 2

Step: 3

Ace Your Homework with AI
Get the answers you need in no time with our AI-driven, step-by-step assistance
Get Started


