Answered step by step
Verified Expert Solution
Question
1 Approved Answer
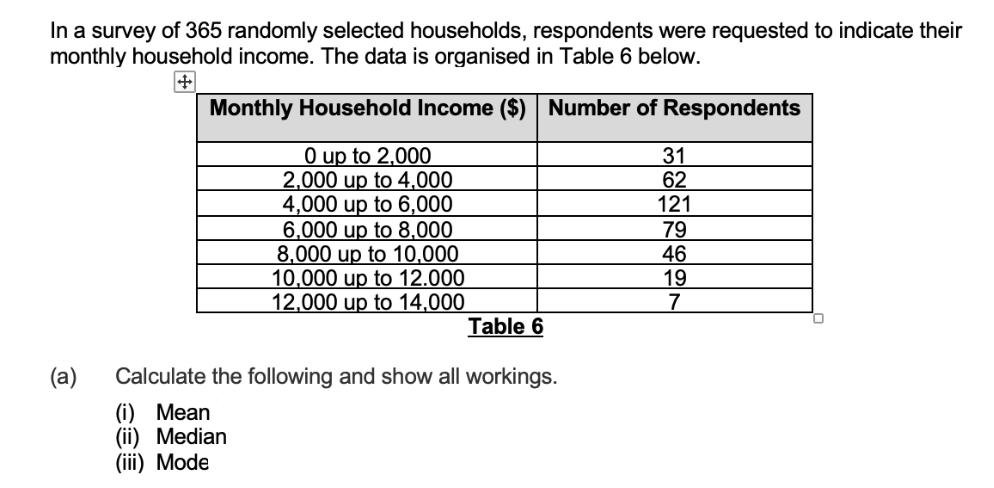
In a survey of 365 randomly selected households, respondents were requested to indicate their monthly household income. The data is organised in Table 6


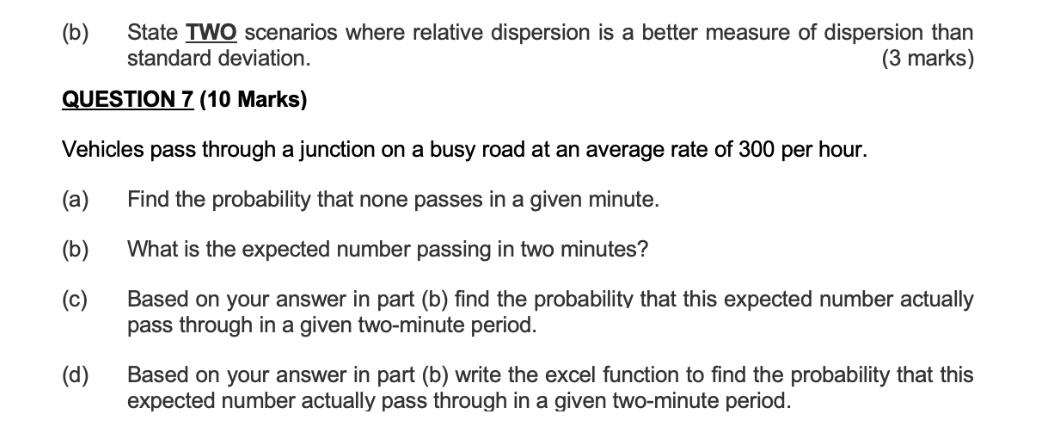
In a survey of 365 randomly selected households, respondents were requested to indicate their monthly household income. The data is organised in Table 6 below. + Monthly Household Income ($) Number of Respondents 0 up to 2,000 2,000 up to 4,000 4,000 up to 6,000 6,000 up to 8,000 31 62 121 79 8,000 up to 10,000 46 10,000 up to 12.000 19 12,000 up to 14,000 7 Table 6 Calculate the following and show all workings. (a) (i) Mean (ii) Median (iii) Mode (b) State TWO scenarios where relative dispersion is a better measure of dispersion than standard deviation. QUESTION 7 (10 Marks) Vehicles pass through a junction on a busy road at an average rate of 300 per hour. (a) Find the probability that none passes in a given minute. (b) What is the expected number passing in two minutes? () (3 marks) Based on your answer in part (b) find the probability that this expected number actually pass through in a given two-minute period. (d) Based on your answer in part (b) write the excel function to find the probability that this expected number actually pass through in a given two-minute period.
Step by Step Solution
There are 3 Steps involved in it
Step: 1

Get Instant Access to Expert-Tailored Solutions
See step-by-step solutions with expert insights and AI powered tools for academic success
Step: 2

Step: 3

Ace Your Homework with AI
Get the answers you need in no time with our AI-driven, step-by-step assistance
Get Started


