Question
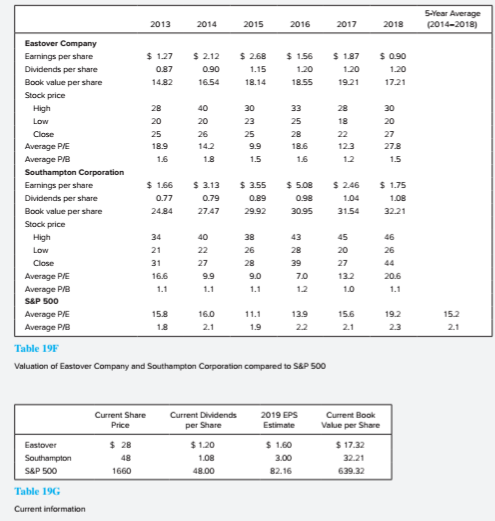
In addition to the discounted dividend model approach, Mulroney decided to look at the price earnings ratio and pricebook ratio, relative to the S&P 500,
In addition to the discounted dividend model approach, Mulroney decided to look at the price earnings ratio and pricebook ratio, relative to the S&P 500, for both Eastover and Southampton. Mulroney elected to perform this analysis using 20142018 and current data.
a. Using the data in Tables 19F and 19G, compute both the current and the 5-year (20142018) average relative priceearnings ratios and relative pricebook ratios for Eastover and Southampton (i.e., ratios relative to those for the S&P 500). Discuss each companys current (2018) relative priceearnings ratio compared to its 5-year average relative priceearnings ratio and each companys current relative pricebook ratio as compared to its 5-year average relative pricebook ratio.
b. Briefly discuss one disadvantage for each of the relative priceearnings and relative price book approaches to valuation.

Average 1141217iwi1 17 127 dg7 342 212 09 165 25 1.15 # *E , 724 Eastover Company Earnings per share Dividends per share Book value per share Stock price High Low Close Average PIE Average PB Southampton Corporation Earnings per share Dividends per share Book value per share Stock price = * 8 & 27 E $ 1 07 277 $ 3 0.g9 29.92 * 5 09 05 246 104 3 54 $ .75 OR 32.21 4 , High LOW = 44 1.1 Close Average PIE Average P/B 54F 800 Average PIE Average PB 460 56 241. 22 24 192 23 Table 195 Valuation of Eastover Company and Southampton Corporation compared to S&P 500 Current Share Price Current Dividends per Share 2019 EPS Estimate Current Book Value per Share $ Eastover Southampton S&P 500 47 224 Table 196 Current information Average 1141217iwi1 17 127 dg7 342 212 09 165 25 1.15 # *E , 724 Eastover Company Earnings per share Dividends per share Book value per share Stock price High Low Close Average PIE Average PB Southampton Corporation Earnings per share Dividends per share Book value per share Stock price = * 8 & 27 E $ 1 07 277 $ 3 0.g9 29.92 * 5 09 05 246 104 3 54 $ .75 OR 32.21 4 , High LOW = 44 1.1 Close Average PIE Average P/B 54F 800 Average PIE Average PB 460 56 241. 22 24 192 23 Table 195 Valuation of Eastover Company and Southampton Corporation compared to S&P 500 Current Share Price Current Dividends per Share 2019 EPS Estimate Current Book Value per Share $ Eastover Southampton S&P 500 47 224 Table 196 Current information
Step by Step Solution
There are 3 Steps involved in it
Step: 1

Get Instant Access to Expert-Tailored Solutions
See step-by-step solutions with expert insights and AI powered tools for academic success
Step: 2

Step: 3

Ace Your Homework with AI
Get the answers you need in no time with our AI-driven, step-by-step assistance
Get Started


