In aggregate, what journal entry did Tesla make to accrue income taxes for the year ended December 31, 2018? You have the amount of income tax expense but will need to infer income tax payable. So, begin the journal entry with what you know about the changes in the valuation allowance, deferred tax assets, deferred tax liabilities and the amount of income tax expense (or benefit) and back into income tax payable.
Required: What journal entry did Tesla make to accrue income taxes for the year ended December 31, 2018?
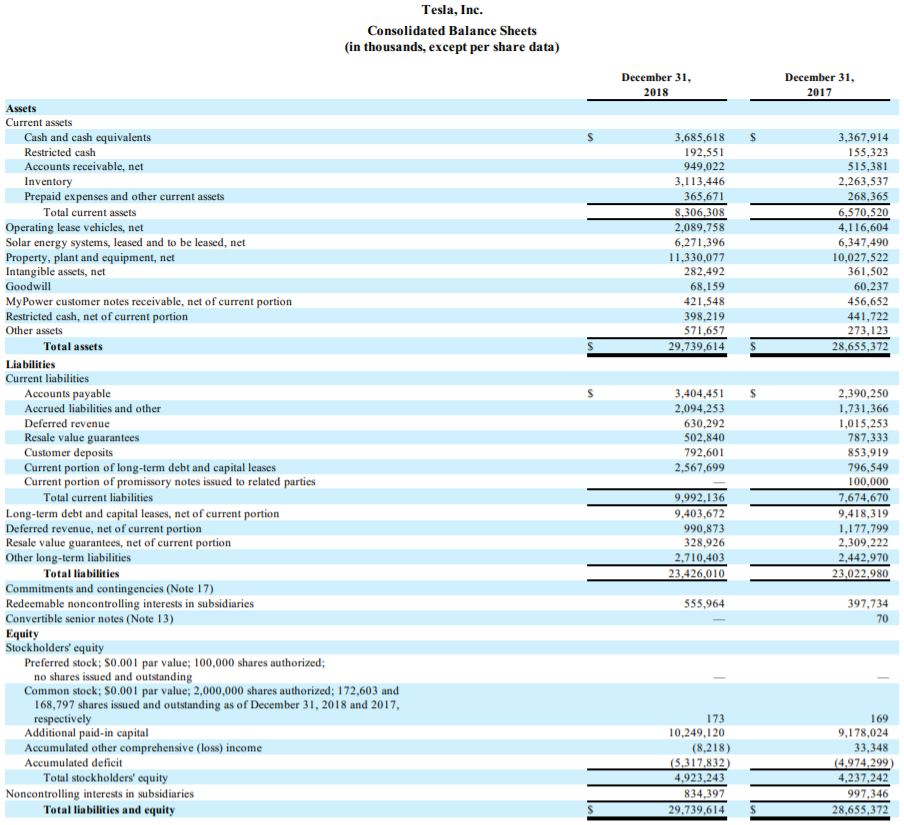
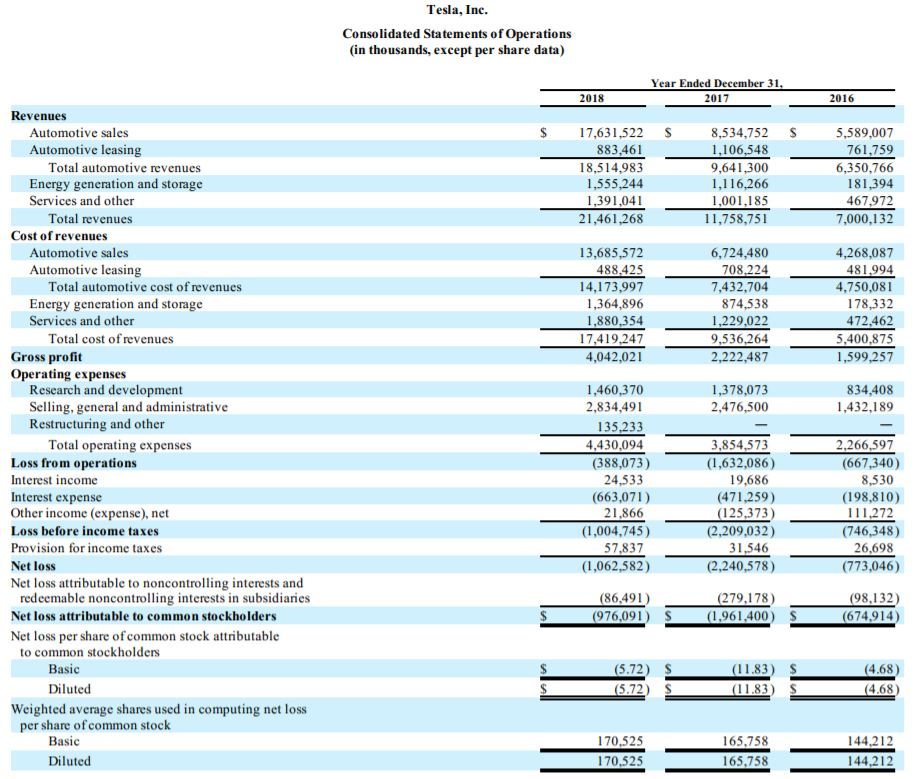
Note: I have provided screenshots of Tesla's deferred tax assets and liabilities, their balance sheet, and their income statement.
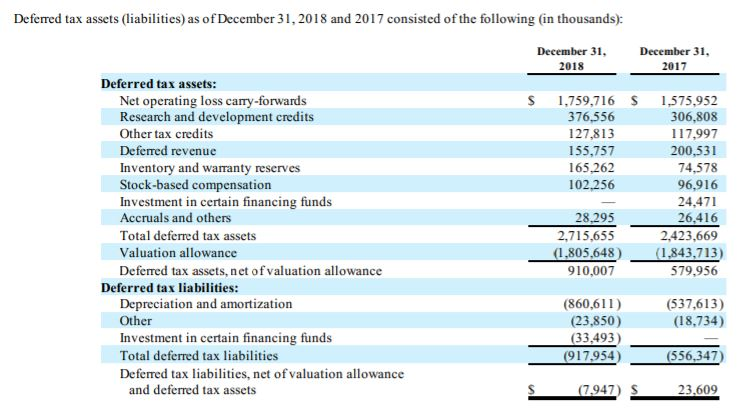
Deferred tax assets (liabilities) as of December 31, 2018 and 2017 consisted of the following in thousands): December 31, 2018 December 31, 2017 $ S 1,759,716 376,556 127,813 155,757 165.262 102.256 Deferred tax assets: Net operating loss carry-forwards Research and development credits Other tax credits Deferred revenue Inventory and warranty reserves Stock-based compensation Investment in certain financing funds Accruals and others Total deferred tax assets Valuation allowance Deferred tax assets, net of valuation allowance Deferred tax liabilities: Depreciation and amortization Other Investment in certain financing funds Total deferred tax liabilities Deferred tax liabilities, net of valuation allowance and deferred tax assets 1,575,952 306,808 117,997 200,531 74,578 96,916 24,471 26.416 2,423,669 (1.843,713) 579,956 28,295 2.715,655 (1.805.648 910,007 (537,613) (18,734) (860,611) (23.850) (33,493) (917,954) (556.347) (7.947) S 23,609 Tesla, Inc. Consolidated Balance Sheets (in thousands, except per share data) December 31, 2018 December 31, 2017 $ 3,685,618 192.551 949,022 3,113,446 365,671 8,306,308 2,089,758 6,271,396 11.330,077 282,492 68,159 421,548 398,219 571,657 29,739,614 3,367,914 155,323 515,381 2,263,537 268,365 6,570,520 4,116,604 6,347,490 10,027,522 361,502 60,237 456,652 441,722 273,123 28,655,372 $ $ S Assets Current assets Cash and cash equivalents Restricted cash Accounts receivable, net Inventory Prepaid expenses and other current assets Total current assets Operating lease vehicles, net Solar energy systems, leased and to be leased, net Property, plant and equipment, net Intangible assets, net Goodwill MyPower customer notes receivable, net of current portion Restricted cash, net of current portion Other assets Total assets Liabilities Current liabilities Accounts payable Accrued liabilities and other Deferred revenue Resale value guarantees Customer deposits Current portion of long-term debt and capital leases Current portion of promissory notes issued to related parties Total current liabilities Long-term debt and capital leases, net of current portion Deferred revenue, net of current portion Resale value guarantees, net of current portion Other long-term liabilities Total liabilities Commitments and contingencies (Note 17) Redeemable noncontrolling interests in subsidiaries Convertible senior notes (Note 13) Equity Stockholders' equity Preferred stock: 90.001 par value: 100,000 shares authorized no shares issued and outstanding Common stock: 50.001 par value; 2,000,000 shares authorized: 172,603 and 168,797 shares issued and outstanding as of December 31, 2018 and 2017, respectively Additional paid-in capital Accumulated other comprehensive (loss) income Accumulated deficit Total stockholders' equity Noncontrolling interests in subsidiaries Total liabilities and equity 3,404,451 2,094,253 630,292 502,840 792,601 2,567,699 2,390,250 1,731,366 1,015,253 787,333 853,919 796,549 100,000 7.674,670 9,418,319 1,177.799 2,309,222 2.442.970 23.022.980 9,992,136 9,403,672 990,873 328,926 2.710,403 23,426,010 555,964 397,734 70 173 10,249,120 (8,218) (5,317,832) 4,923,243 834,397 29,739,614 169 9,178,024 33,348 (4.974,299) 4,237,242 997,346 28,655.372 $ $ Tesla, Inc. Consolidated Statements of Operations in thousands, except per share data) Year Ended December 31, 2017 2018 2016 $ S $ 17,631,522 883,461 18,514,983 1,555,244 1,391,041 21,461,268 8,534,752 1,106,548 9,641,300 1,116,266 1,001,185 11,758,751 5,589,007 761,759 6,350,766 181,394 467,972 7,000,132 13,685,572 488.425 14,173,997 1,364,896 1,880,354 17,419,247 4,042,021 6,724,480 708,224 7,432,704 874,538 1,229,022 9,536,264 2,222,487 4,268,087 481.994 4,750,081 178,332 472.462 5,400,875 1,599,257 1,378,073 2,476,500 834,408 1,432,189 Revenues Automotive sales Automotive leasing Total automotive revenues Energy generation and storage Services and other Total revenues Cost of revenues Automotive sales Automotive leasing Total automotive cost of revenues Energy generation and storage Services and other Total cost of revenues Gross profit Operating expenses Research and development Selling, general and administrative Restructuring and other Total operating expenses Loss from operations Interest income Interest expense Other income (expense), net Loss before income taxes Provision for income taxes Net loss Net loss attributable to noncontrolling interests and redeemable noncontrolling interests in subsidiaries Net loss attributable to common stockholders Net loss per share of common stock attributable to common stockholders Basic Diluted Weighted average shares used in computing net loss per share of common stock Basic Diluted 1,460,370 2,834,491 135,233 4,430,094 (388,073) 24,533 (663,071) 21,866 (1,004,745 ) 57,837 (1,062,582) 3,854,573 (1,632,086) 19,686 (471,259) (125,373) (2,209,032) 31,546 (2,240,578) 2,266,597 (667,340) 8,530 (198,810) 111.272 (746,348) 26,698 (773,046) (86,491) (976,091 (279,178) (1,961,400) (98,132) (674,914) $ S $ S S (4.68) (5.72) (5.72) (11.83) (11.83) (4.68) 170,525 170.525 165,758 165,758 144,212 144,212 Deferred tax assets (liabilities) as of December 31, 2018 and 2017 consisted of the following in thousands): December 31, 2018 December 31, 2017 $ S 1,759,716 376,556 127,813 155,757 165.262 102.256 Deferred tax assets: Net operating loss carry-forwards Research and development credits Other tax credits Deferred revenue Inventory and warranty reserves Stock-based compensation Investment in certain financing funds Accruals and others Total deferred tax assets Valuation allowance Deferred tax assets, net of valuation allowance Deferred tax liabilities: Depreciation and amortization Other Investment in certain financing funds Total deferred tax liabilities Deferred tax liabilities, net of valuation allowance and deferred tax assets 1,575,952 306,808 117,997 200,531 74,578 96,916 24,471 26.416 2,423,669 (1.843,713) 579,956 28,295 2.715,655 (1.805.648 910,007 (537,613) (18,734) (860,611) (23.850) (33,493) (917,954) (556.347) (7.947) S 23,609 Tesla, Inc. Consolidated Balance Sheets (in thousands, except per share data) December 31, 2018 December 31, 2017 $ 3,685,618 192.551 949,022 3,113,446 365,671 8,306,308 2,089,758 6,271,396 11.330,077 282,492 68,159 421,548 398,219 571,657 29,739,614 3,367,914 155,323 515,381 2,263,537 268,365 6,570,520 4,116,604 6,347,490 10,027,522 361,502 60,237 456,652 441,722 273,123 28,655,372 $ $ S Assets Current assets Cash and cash equivalents Restricted cash Accounts receivable, net Inventory Prepaid expenses and other current assets Total current assets Operating lease vehicles, net Solar energy systems, leased and to be leased, net Property, plant and equipment, net Intangible assets, net Goodwill MyPower customer notes receivable, net of current portion Restricted cash, net of current portion Other assets Total assets Liabilities Current liabilities Accounts payable Accrued liabilities and other Deferred revenue Resale value guarantees Customer deposits Current portion of long-term debt and capital leases Current portion of promissory notes issued to related parties Total current liabilities Long-term debt and capital leases, net of current portion Deferred revenue, net of current portion Resale value guarantees, net of current portion Other long-term liabilities Total liabilities Commitments and contingencies (Note 17) Redeemable noncontrolling interests in subsidiaries Convertible senior notes (Note 13) Equity Stockholders' equity Preferred stock: 90.001 par value: 100,000 shares authorized no shares issued and outstanding Common stock: 50.001 par value; 2,000,000 shares authorized: 172,603 and 168,797 shares issued and outstanding as of December 31, 2018 and 2017, respectively Additional paid-in capital Accumulated other comprehensive (loss) income Accumulated deficit Total stockholders' equity Noncontrolling interests in subsidiaries Total liabilities and equity 3,404,451 2,094,253 630,292 502,840 792,601 2,567,699 2,390,250 1,731,366 1,015,253 787,333 853,919 796,549 100,000 7.674,670 9,418,319 1,177.799 2,309,222 2.442.970 23.022.980 9,992,136 9,403,672 990,873 328,926 2.710,403 23,426,010 555,964 397,734 70 173 10,249,120 (8,218) (5,317,832) 4,923,243 834,397 29,739,614 169 9,178,024 33,348 (4.974,299) 4,237,242 997,346 28,655.372 $ $ Tesla, Inc. Consolidated Statements of Operations in thousands, except per share data) Year Ended December 31, 2017 2018 2016 $ S $ 17,631,522 883,461 18,514,983 1,555,244 1,391,041 21,461,268 8,534,752 1,106,548 9,641,300 1,116,266 1,001,185 11,758,751 5,589,007 761,759 6,350,766 181,394 467,972 7,000,132 13,685,572 488.425 14,173,997 1,364,896 1,880,354 17,419,247 4,042,021 6,724,480 708,224 7,432,704 874,538 1,229,022 9,536,264 2,222,487 4,268,087 481.994 4,750,081 178,332 472.462 5,400,875 1,599,257 1,378,073 2,476,500 834,408 1,432,189 Revenues Automotive sales Automotive leasing Total automotive revenues Energy generation and storage Services and other Total revenues Cost of revenues Automotive sales Automotive leasing Total automotive cost of revenues Energy generation and storage Services and other Total cost of revenues Gross profit Operating expenses Research and development Selling, general and administrative Restructuring and other Total operating expenses Loss from operations Interest income Interest expense Other income (expense), net Loss before income taxes Provision for income taxes Net loss Net loss attributable to noncontrolling interests and redeemable noncontrolling interests in subsidiaries Net loss attributable to common stockholders Net loss per share of common stock attributable to common stockholders Basic Diluted Weighted average shares used in computing net loss per share of common stock Basic Diluted 1,460,370 2,834,491 135,233 4,430,094 (388,073) 24,533 (663,071) 21,866 (1,004,745 ) 57,837 (1,062,582) 3,854,573 (1,632,086) 19,686 (471,259) (125,373) (2,209,032) 31,546 (2,240,578) 2,266,597 (667,340) 8,530 (198,810) 111.272 (746,348) 26,698 (773,046) (86,491) (976,091 (279,178) (1,961,400) (98,132) (674,914) $ S $ S S (4.68) (5.72) (5.72) (11.83) (11.83) (4.68) 170,525 170.525 165,758 165,758 144,212 144,212