In an effort to understand how successful the promotion was, Pelican Stores management has
produced the following statistics about this sample of 100 in-store customers that make a
purchase during this one-day promotional event.
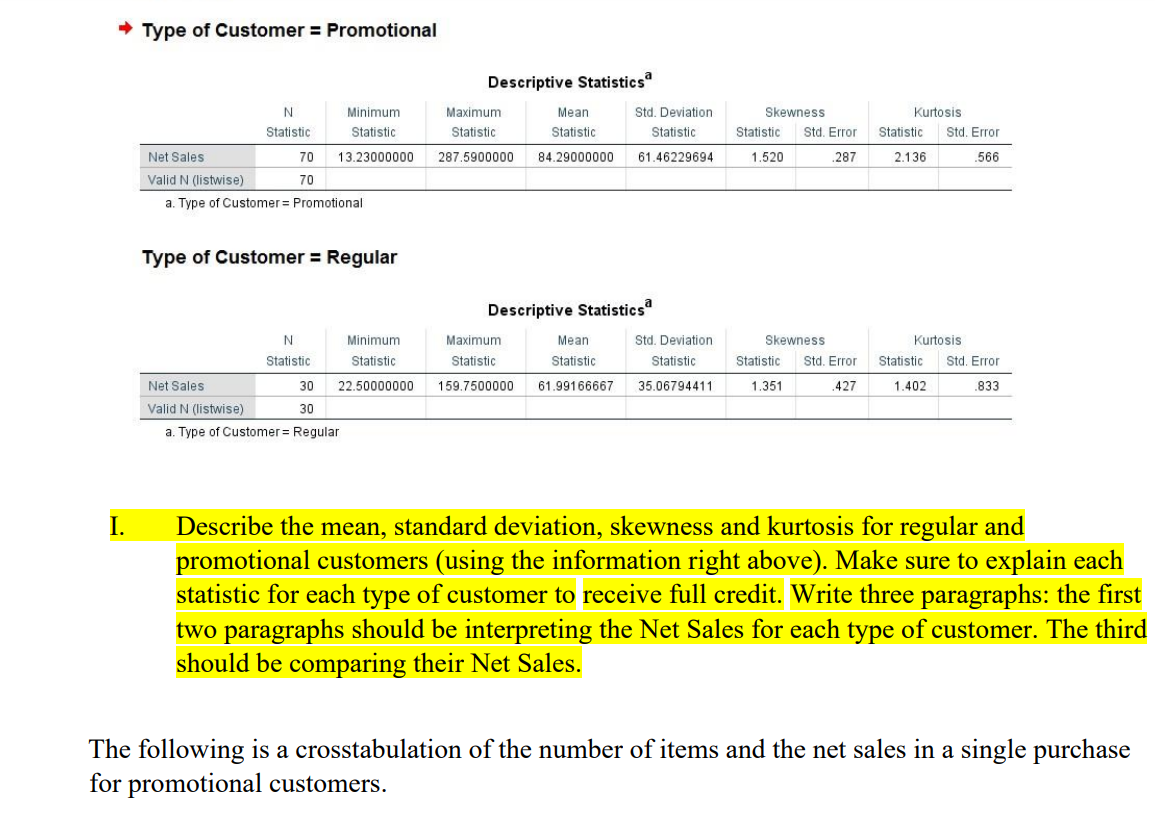
The following are the descriptive statistics for the variables NetSales separated by customer type
(promotional or regular).
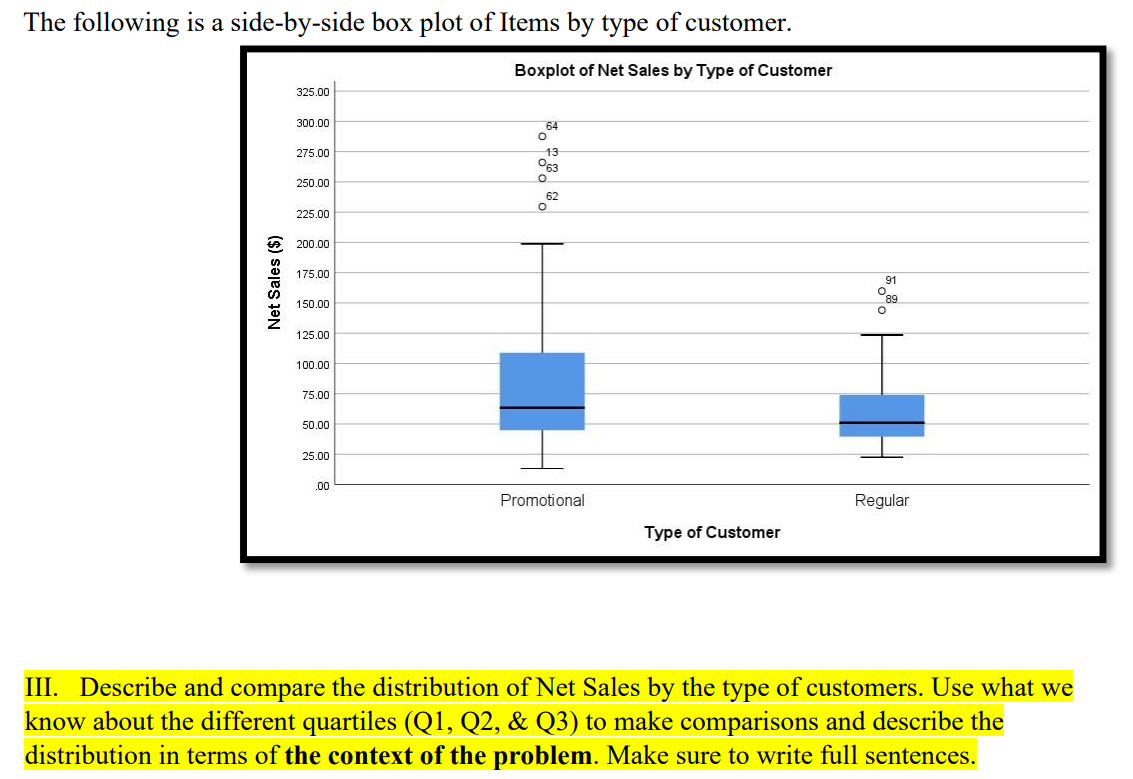
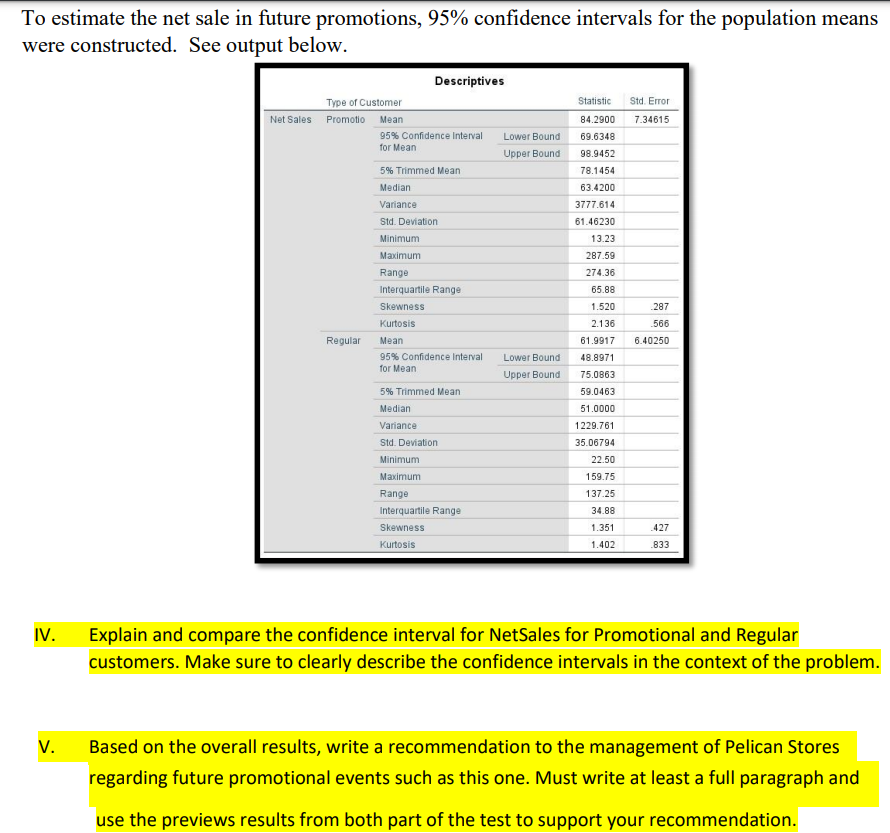
* Type of Customer = Promotional Descriptive Statistics N Minimum Maximum Mean Std. Deviation Skewness Kurtosis Statistic Statistic Statistic Statistic Statistic Statistic Std. Error Statistic Std. Error Net Sales 70 13.23000000 287.5900000 84.29000000 61.46229694 1.520 287 2.136 566 Valid N (listwise) 70 a. Type of Customer = Promotional Type of Customer = Regular Descriptive Statistics N Minimum Maximum Mean Std. Deviation Skewness Kurtosis Statistic Statistic Statistic Statistic Statistic Statistic Std. Error Statistic Std. Error Net Sales 30 22.50000000 159.7500000 61.99166667 35.06794411 1.351 427 1.402 833 Valid N (listwise) 30 a. Type of Customer = Regular I. Describe the mean, standard deviation, skewness and kurtosis for regular and promotional customers (using the information right above). Make sure to explain each statistic for each type of customer to receive full credit. Write three paragraphs: the first two paragraphs should be interpreting the Net Sales for each type of customer. The third should be comparing their Net Sales. The following is a crosstabulation of the number of items and the net sales in a single purchase for promotional customers.Promotional Customers Total 14 17 8 - - 0 00 0 10 1 1 1 13 1 - -- W 17 1 Total 13 19 13 1 8 5 4 2 2 1 1 70 II. Using the crosstabulation right above, describe the relationship between the number of items and the net sales earned. Please make sure to write enough to fully described the relationship (give examples to show the relationship).The following is a side-by-sidc box plot of Items by type of customer. Boxplot of Net Sales by Type of Customer '63 13 063 .o 62 o E m 2 N U) II-l In 2 Promotional Regular Type of Customer III. Describe and compare the distribution of Net Sales by the type of customers. Use What we know about the different quartiles (Q1, Q2, & Q3) to make comparisons and describe the distribution in terms of the context of the problem. Make sure to write full sentences. To estimate the net sale in future promotions, 95% confidence intervals for the population means were constructed. See output below. Descriptives Type of Customer Statistic Std. Error Net Sales Promotion Mean 84.2900 7.34615 95% Confidence Interval Lower Bound 69.6348 for Mean Upper Bound 98.9452 5% Trimmed Mean 78.1454 Median 63.4200 Variance 3777.614 Sid_ Deviation 61.46230 Minimum 13.23 Maximum 287.59 Range 274.36 Interquartile Range 65.88 Skewness 1.520 287 Kurtosis 2.136 566 Regular Mean 61.9917 6.40250 95% Confidence Interval Lower Bound 48.8971 for Mean Upper Bound 75.0863 5% Trimmed Mean 59.0463 Median 51.0000 Variance 1229.761 Sid_ Deviation 35.06794 Minimum 22.50 Maximum 159.75 Range 37.25 Interquartile Range 34.88 Skewness 1.351 427 Kurtosis 1.402 833 IV. Explain and compare the confidence interval for NetSales for Promotional and Regular customers. Make sure to clearly describe the confidence intervals in the context of the problem. V. Based on the overall results, write a recommendation to the management of Pelican Stores regarding future promotional events such as this one. Must write at least a full paragraph and use the previews results from both part of the test to support your recommendation