

Question
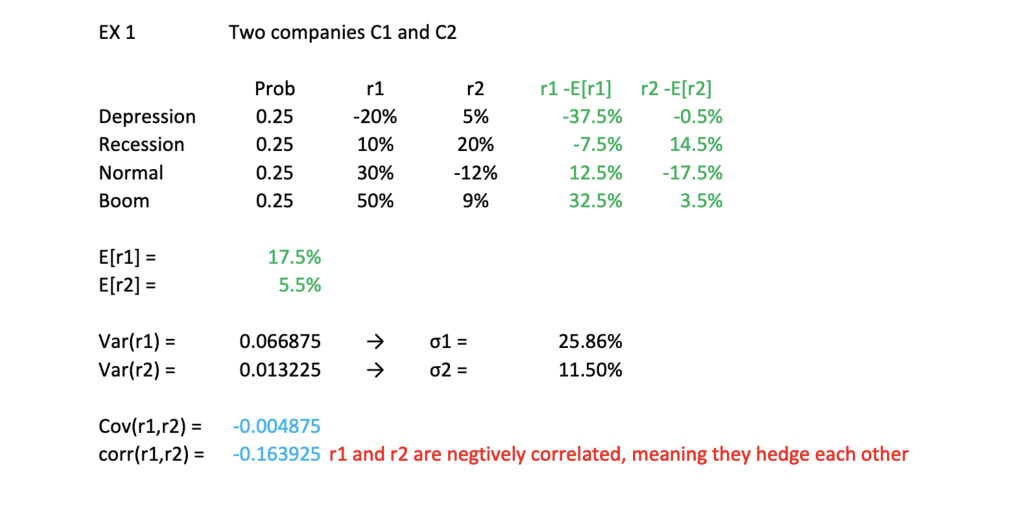
In an Excel file, plot the risk (portfolio standard deviation) - expected return of the portfolio from two stocks from Examples 1 and 2 (refer
In an Excel file, plot the risk (portfolio standard deviation) - expected return of the portfolio from two stocks from Examples 1 and 2 (refer to the image below) such that:
1. The risk goes to the horizontal axis
2. The weight alpha of stock 1 should vary from 0 to 1, with increment of 0.05, to yield 20 point plot
Step by Step Solution
There are 3 Steps involved in it
Step: 1

Get Instant Access to Expert-Tailored Solutions
See step-by-step solutions with expert insights and AI powered tools for academic success
Step: 2

Step: 3
Ace Your Homework with AI
Get the answers you need in no time with our AI-driven, step-by-step assistance
Get Started
De Gruyter Handbook Of Entrepreneurial Finance
Authors: David Lingelbach
1st Edition
3110726750,3110726351