In an experiment research, two drugs, both in tablet form, were each given to the same five volunteer subjects in a pilot trial. Drug A was given first and drug B second, with a washout period between. In each phase antibiotic blood serum levels were measured 1, 2, 3 and 6 hours after medication. Data collected as presented in table 2 were analysed using SPSS and the SPSS Exceerpts of SPSS Output are displayed in page 14, 15, 17 and 18. At 0.05 level of significant, test whether the drugs affected the antibiotic blood serum level, the trial/time affected the antibiotics blood serum level or whether the drugs influences the antibiotic blood serum level varying by trial/time.
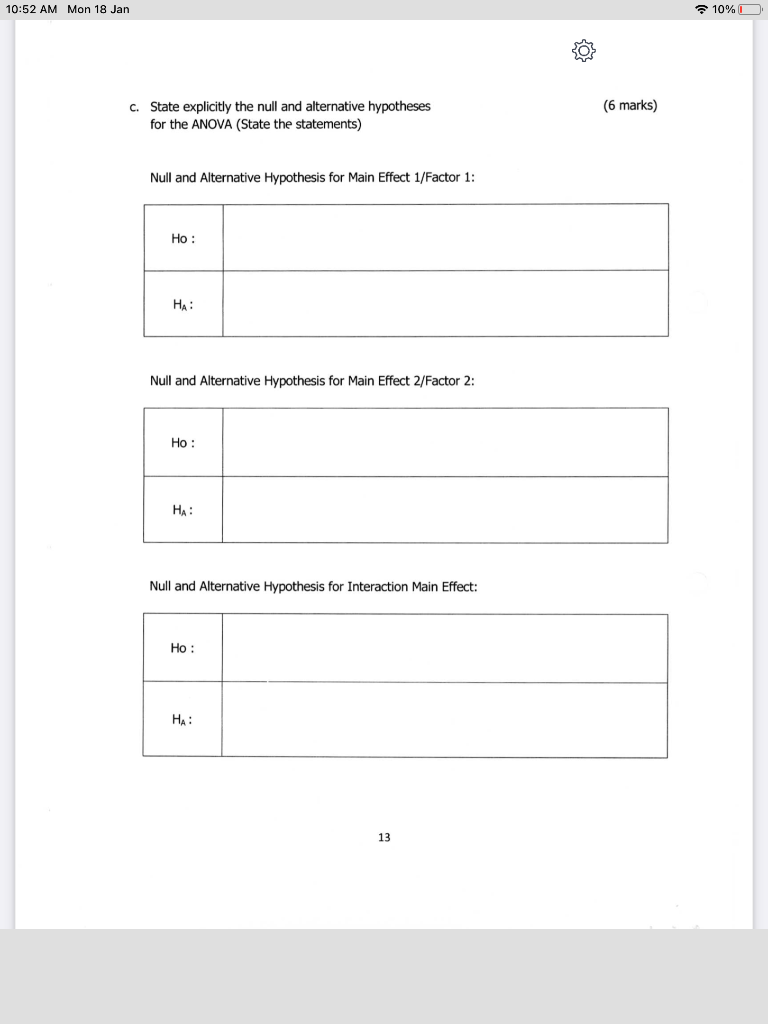
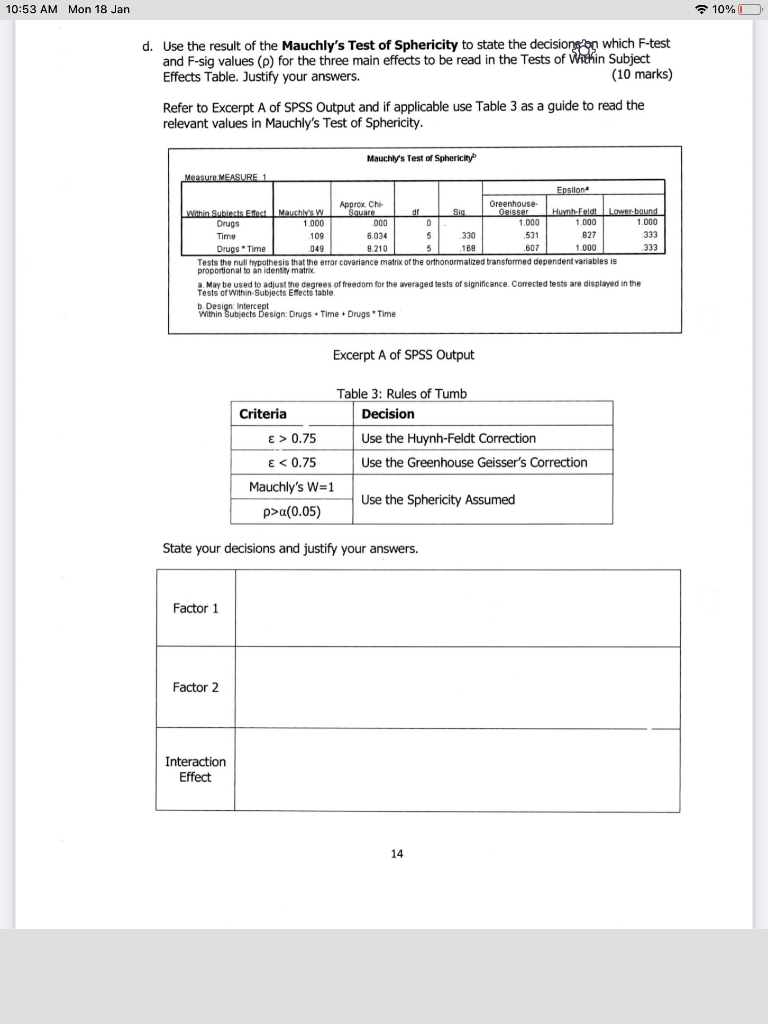
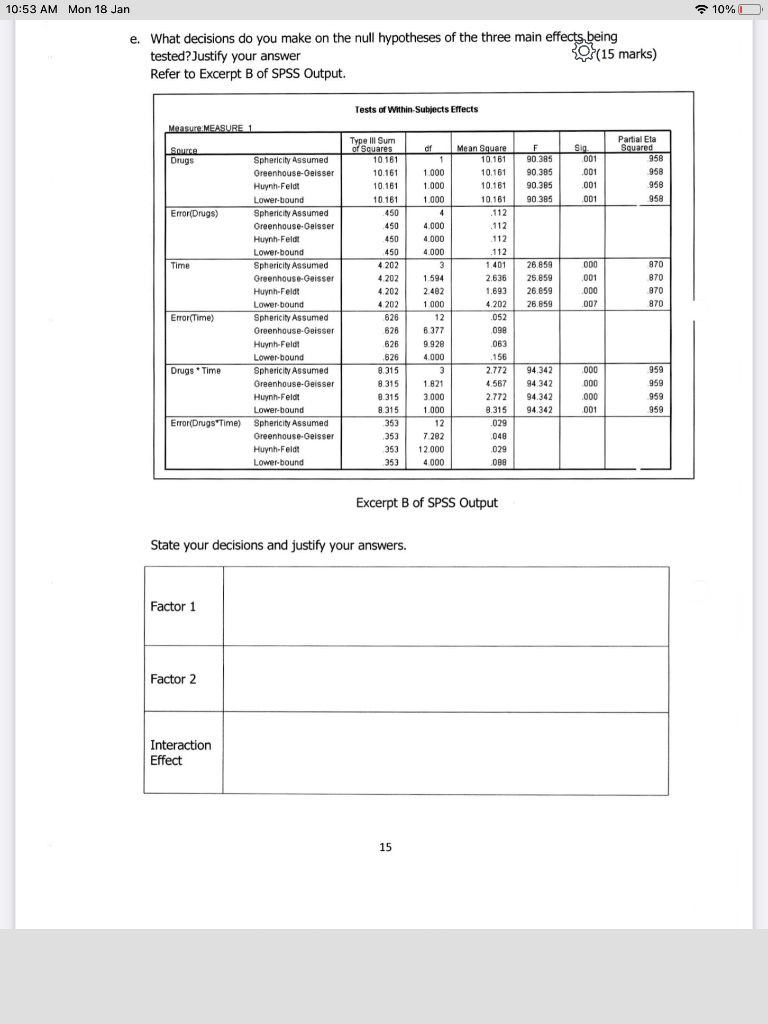
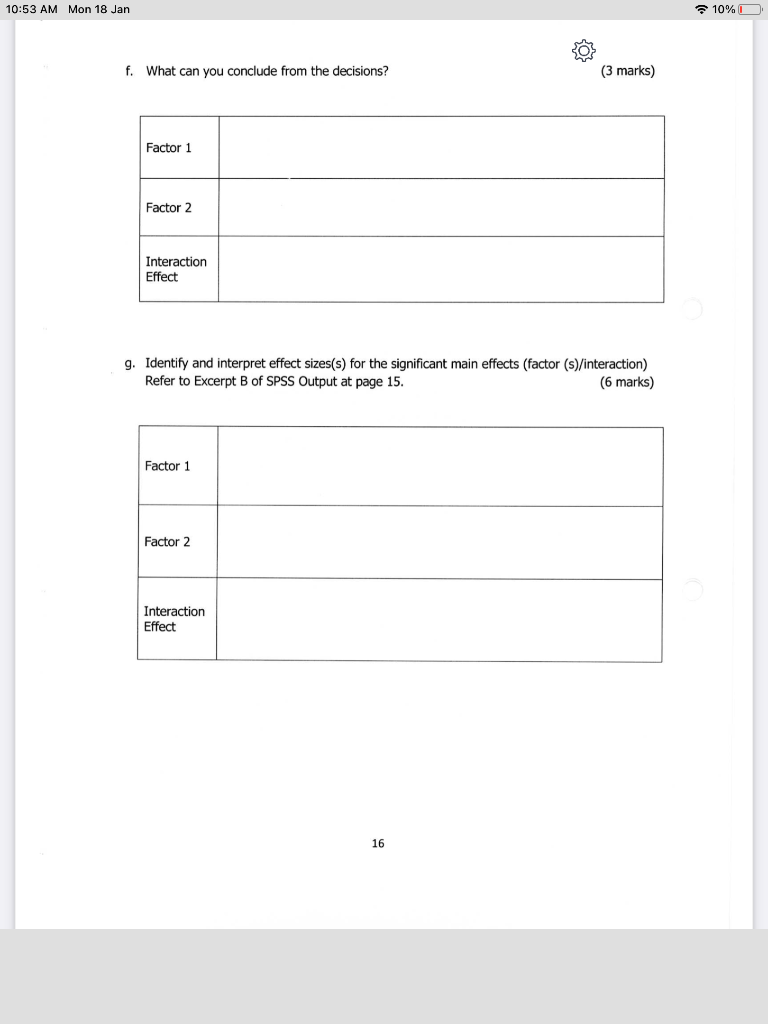
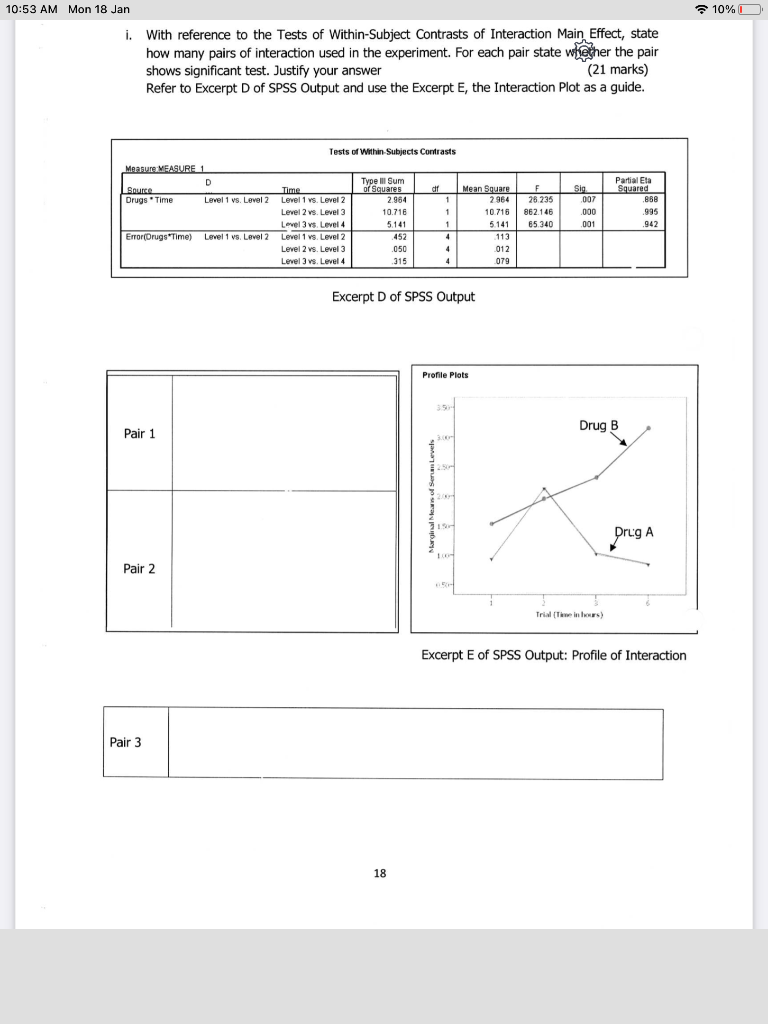
10:52 AM Mon 18 Jan 10% PART C QUESTION 1 (106 MARKS) In an experimental research, two drugs, both in tablet form, were each given to the same five volunteer subjects in a pilot trial. Drug A was given first and drug B second, with a washout period in between. In each phase antibiotic blood serum levels were measured 1, 2, 3, and 6 hours after medication. Data collected as presented in Table 2 were analysed using SPSS and the SPSS Excerpts of SPSS Output are displayed in page 14, 15, 17 and 18. At 0.05 level of significant, test whether the drugs affect the antibiotic blood serum level, the trial/time affect the antibiotic blood serum level or whether the drugs influence the antibiotic blood serum level varying by trial/time. (Adapted from Crowder and Hand, 1990:9) Subject Table 2: : Antibiotic Serum Level by Drugs and Time Drug A Drug B Time (Hours) Time Hours 2 2 3 6 1 2 3 2.51 1.06 1.21 1.57 2.53 2.62 2.34 1.21 0.96 1.62 1.88 2.33 1.92 0.97 0.9 1.65 1.92 2.32 2.01 1.03 0.61 1.32 1.48 1.84 1.83 0.82 0.52 1.48 1.95 2.45 1 1.08 1.19 1.22 0.6 0.55 1 2 3 4 5 6 6 3.95 3.48 2.95 2.39 2.97 Based on the SPSS output in page 14, 15, 17 and 18 answer the following questions: a. What is the appropriate type of Analysis of Variance (ANOVA) used in the study? (1 mark) b. What are the Independent Variable (IDV) /Factor and Dependent variable (DV) used in the analysis? State the scale of measurement for the variables? (6 marks) IDV or Factor: DV 12 10:52 AM Mon 18 Jan 10% (6 marks) c. State explicitly the null and alternative hypotheses for the ANOVA (State the statements) Null and Alternative Hypothesis for Main Effect 1/Factor 1: Ho : HA: Null and Alternative Hypothesis for Main Effect 2/Factor 2: Ho : HA Null and Alternative Hypothesis for Interaction Main Effect: Ho : HA: 13 10:53 AM Mon 18 Jan 10% d. Use the result of the Mauchly's Test of Sphericity to state the decisiong on which F-test and F-sig values (p) for the three main effects to be read in the Tests of Within Subject Effects Table. Justify your answers. (10 marks) Refer to Excerpt A of SPSS Output and if applicable use Table 3 as a guide to read the relevant values in Mauchly's Test of Sphericity. Mauchly's Test of Sphericity Measure MEASURE 1 Epsilon Approx. CH Greenhouse Within Subiects Effect Mauchlys W Square Sig Huynh Fuld Lower bound Drugs 1 000 000 0 1.000 1.000 1.000 Time 109 6.034 5 330 531 827 333 Drugs Time 049 8.210 5 168 .607 1.000 333 Tests the null hypothesis that the error covariance matrix of the orthonormalized transformed dependent variables is proportional to an identity matrix a. May be used to adjust the degrees of freedom for the averaged tests of significance. Corrected tests are displayed in the Tests of Within-Subjects Effects table b. Design Intercept Within Subjects Design: Drugs Time + Drugs' Time Excerpt A of SPSS Output Table 3: Rules of Tumb Criteria Decision E >0.75 Use the Huynh-Feldt Correction E 0.05) State your decisions and justify your answers. Factor 1 Factor 2 Interaction Effect 14 10:53 AM Mon 18 Jan 10% e. What decisions do you make on the null hypotheses of the three main effects.being tested?Justify your answer 30%(15 marks) Refer to Excerpt B of SPSS Output. Tests of Within-Subjects Effects Measure MEASURE 1 Drugs F 90.385 90.389 90.385 90 385 Sig 001 ,001 001 .001 Partial Ela Squared 958 958 958 958 Se Sphericity Assumed Greenhouse-eisser Huy Felds Lower-bound Error(Drugs) Sphericity Assumed Greenhouse-Gelsser Huynh-Felti Lower bound Time Sphericity Assumed Greenhouse-Geisser Huy T-Flat Lower-bound Error(Time) Sphericity Assumed Greenhouse-Geisser Huynh Full Lower bound Drugs * Time Sphericity Assumed Greenhouse-Geisser Hurt-Felgi Lower-bound Error(Drugs 'Time) Sphericity Assumed Greenhouse-Geisser Huynh Felds Lower bound Type III Sum of Squares 10.161 10.161 10.161 10.161 .450 450 .450 450 4202 4.202 4.202 4 202 628 828 626 .626 8.315 8.315 8.315 8.315 353 353 353 353 dr 1 1.000 1.000 1.000 4 4.000 4.000 4.000 3 1.594 2.482 1.000 12 8.377 9.928 4.000 3 1.821 3.000 1.000 12 7.282 12.000 4.000 Mean Square 10.161 10.161 10.161 10.161 .112 112 .112 .112 1.401 2.636 1.693 4.202 052 098 .063 156 2.772 4.567 2.772 8.315 ,029 048 029 089 26.859 25.859 26.659 26.859 000 .001 000 .007 870 870 970 870 000 94.342 94342 94.342 94.342 000 .000 ,001 959 959 959 959 Excerpt B of SPSS Output State your decisions and justify your answers. Factor 1 Factor 2 Interaction Effect 15 10:53 AM Mon 18 Jan 10% f. What can you conclude from the decisions? (3 marks) Factor 1 Factor 2 Interaction Effect g. Identify and interpret effect sizes(s) for the significant main effects (factor (s)/interaction) Refer to Excerpt B of SPSS Output at page 15. (6 marks) Factor 1 Factor 2 Interaction Effect 16 10% 10:53 AM Mon 18 Jan i. With reference to the Tests of Within-Subject Contrasts of Interaction Main Effect, state how many pairs of interaction used in the experiment. For each pair state whether the pair shows significant test. Justify your answer (21 marks) Refer to Excerpt D of SPSS Output and use the Excerpt E, the Interaction Plot as a guide. Sia 007 Tests of Within-Subjects Contrasts Measure MEASURE 1 D Type Il Sum Source Time of Squares df Drugs Time Level 1 vs. Level 2 Level 1 vs Level 2 2.964 1 Level 2 vs. Level 3 10.716 1 Level 3 vs. Level 4 5.141 1 Error(Drugs Time) Level 1 vs. Level 2 Level 1 vs Level 2 452 4 Level 2 vs. Level 3 050 4 Level 3 vs. Level 4 315 4 4 Mean Square 2964 10.718 5.141 113 012 079 F 28.235 862.14 65.340 Partial Eta Squared 858 995 .942 .000 001 Excerpt D of SPSS Output Profile Plots Pair 1 Drug B Drug A Pair 2 Trial Twins) Excerpt E of SPSS Output: Profile of Interaction Pair 3 18 10:52 AM Mon 18 Jan 10% PART C QUESTION 1 (106 MARKS) In an experimental research, two drugs, both in tablet form, were each given to the same five volunteer subjects in a pilot trial. Drug A was given first and drug B second, with a washout period in between. In each phase antibiotic blood serum levels were measured 1, 2, 3, and 6 hours after medication. Data collected as presented in Table 2 were analysed using SPSS and the SPSS Excerpts of SPSS Output are displayed in page 14, 15, 17 and 18. At 0.05 level of significant, test whether the drugs affect the antibiotic blood serum level, the trial/time affect the antibiotic blood serum level or whether the drugs influence the antibiotic blood serum level varying by trial/time. (Adapted from Crowder and Hand, 1990:9) Subject Table 2: : Antibiotic Serum Level by Drugs and Time Drug A Drug B Time (Hours) Time Hours 2 2 3 6 1 2 3 2.51 1.06 1.21 1.57 2.53 2.62 2.34 1.21 0.96 1.62 1.88 2.33 1.92 0.97 0.9 1.65 1.92 2.32 2.01 1.03 0.61 1.32 1.48 1.84 1.83 0.82 0.52 1.48 1.95 2.45 1 1.08 1.19 1.22 0.6 0.55 1 2 3 4 5 6 6 3.95 3.48 2.95 2.39 2.97 Based on the SPSS output in page 14, 15, 17 and 18 answer the following questions: a. What is the appropriate type of Analysis of Variance (ANOVA) used in the study? (1 mark) b. What are the Independent Variable (IDV) /Factor and Dependent variable (DV) used in the analysis? State the scale of measurement for the variables? (6 marks) IDV or Factor: DV 12 10:52 AM Mon 18 Jan 10% (6 marks) c. State explicitly the null and alternative hypotheses for the ANOVA (State the statements) Null and Alternative Hypothesis for Main Effect 1/Factor 1: Ho : HA: Null and Alternative Hypothesis for Main Effect 2/Factor 2: Ho : HA Null and Alternative Hypothesis for Interaction Main Effect: Ho : HA: 13 10:53 AM Mon 18 Jan 10% d. Use the result of the Mauchly's Test of Sphericity to state the decisiong on which F-test and F-sig values (p) for the three main effects to be read in the Tests of Within Subject Effects Table. Justify your answers. (10 marks) Refer to Excerpt A of SPSS Output and if applicable use Table 3 as a guide to read the relevant values in Mauchly's Test of Sphericity. Mauchly's Test of Sphericity Measure MEASURE 1 Epsilon Approx. CH Greenhouse Within Subiects Effect Mauchlys W Square Sig Huynh Fuld Lower bound Drugs 1 000 000 0 1.000 1.000 1.000 Time 109 6.034 5 330 531 827 333 Drugs Time 049 8.210 5 168 .607 1.000 333 Tests the null hypothesis that the error covariance matrix of the orthonormalized transformed dependent variables is proportional to an identity matrix a. May be used to adjust the degrees of freedom for the averaged tests of significance. Corrected tests are displayed in the Tests of Within-Subjects Effects table b. Design Intercept Within Subjects Design: Drugs Time + Drugs' Time Excerpt A of SPSS Output Table 3: Rules of Tumb Criteria Decision E >0.75 Use the Huynh-Feldt Correction E 0.05) State your decisions and justify your answers. Factor 1 Factor 2 Interaction Effect 14 10:53 AM Mon 18 Jan 10% e. What decisions do you make on the null hypotheses of the three main effects.being tested?Justify your answer 30%(15 marks) Refer to Excerpt B of SPSS Output. Tests of Within-Subjects Effects Measure MEASURE 1 Drugs F 90.385 90.389 90.385 90 385 Sig 001 ,001 001 .001 Partial Ela Squared 958 958 958 958 Se Sphericity Assumed Greenhouse-eisser Huy Felds Lower-bound Error(Drugs) Sphericity Assumed Greenhouse-Gelsser Huynh-Felti Lower bound Time Sphericity Assumed Greenhouse-Geisser Huy T-Flat Lower-bound Error(Time) Sphericity Assumed Greenhouse-Geisser Huynh Full Lower bound Drugs * Time Sphericity Assumed Greenhouse-Geisser Hurt-Felgi Lower-bound Error(Drugs 'Time) Sphericity Assumed Greenhouse-Geisser Huynh Felds Lower bound Type III Sum of Squares 10.161 10.161 10.161 10.161 .450 450 .450 450 4202 4.202 4.202 4 202 628 828 626 .626 8.315 8.315 8.315 8.315 353 353 353 353 dr 1 1.000 1.000 1.000 4 4.000 4.000 4.000 3 1.594 2.482 1.000 12 8.377 9.928 4.000 3 1.821 3.000 1.000 12 7.282 12.000 4.000 Mean Square 10.161 10.161 10.161 10.161 .112 112 .112 .112 1.401 2.636 1.693 4.202 052 098 .063 156 2.772 4.567 2.772 8.315 ,029 048 029 089 26.859 25.859 26.659 26.859 000 .001 000 .007 870 870 970 870 000 94.342 94342 94.342 94.342 000 .000 ,001 959 959 959 959 Excerpt B of SPSS Output State your decisions and justify your answers. Factor 1 Factor 2 Interaction Effect 15 10:53 AM Mon 18 Jan 10% f. What can you conclude from the decisions? (3 marks) Factor 1 Factor 2 Interaction Effect g. Identify and interpret effect sizes(s) for the significant main effects (factor (s)/interaction) Refer to Excerpt B of SPSS Output at page 15. (6 marks) Factor 1 Factor 2 Interaction Effect 16 10% 10:53 AM Mon 18 Jan i. With reference to the Tests of Within-Subject Contrasts of Interaction Main Effect, state how many pairs of interaction used in the experiment. For each pair state whether the pair shows significant test. Justify your answer (21 marks) Refer to Excerpt D of SPSS Output and use the Excerpt E, the Interaction Plot as a guide. Sia 007 Tests of Within-Subjects Contrasts Measure MEASURE 1 D Type Il Sum Source Time of Squares df Drugs Time Level 1 vs. Level 2 Level 1 vs Level 2 2.964 1 Level 2 vs. Level 3 10.716 1 Level 3 vs. Level 4 5.141 1 Error(Drugs Time) Level 1 vs. Level 2 Level 1 vs Level 2 452 4 Level 2 vs. Level 3 050 4 Level 3 vs. Level 4 315 4 4 Mean Square 2964 10.718 5.141 113 012 079 F 28.235 862.14 65.340 Partial Eta Squared 858 995 .942 .000 001 Excerpt D of SPSS Output Profile Plots Pair 1 Drug B Drug A Pair 2 Trial Twins) Excerpt E of SPSS Output: Profile of Interaction Pair 3 18


