

Answered step by step
Verified Expert Solution
Question
1 Approved Answer
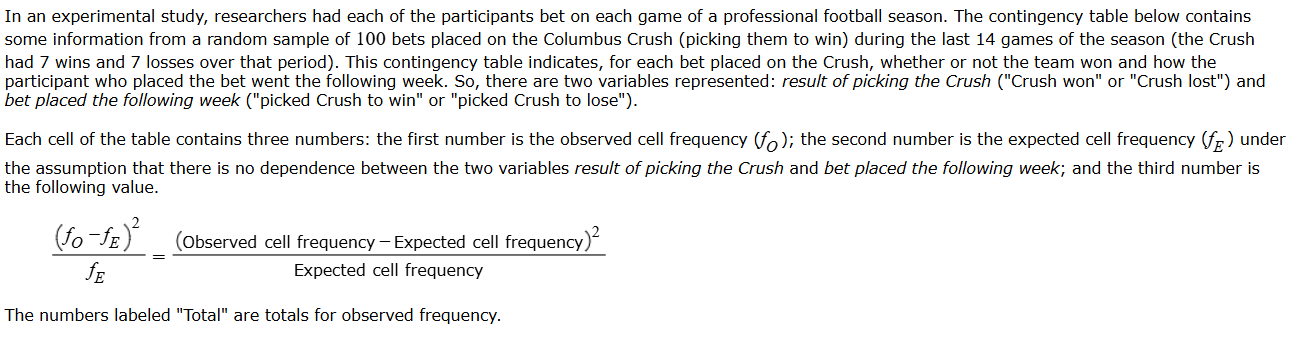
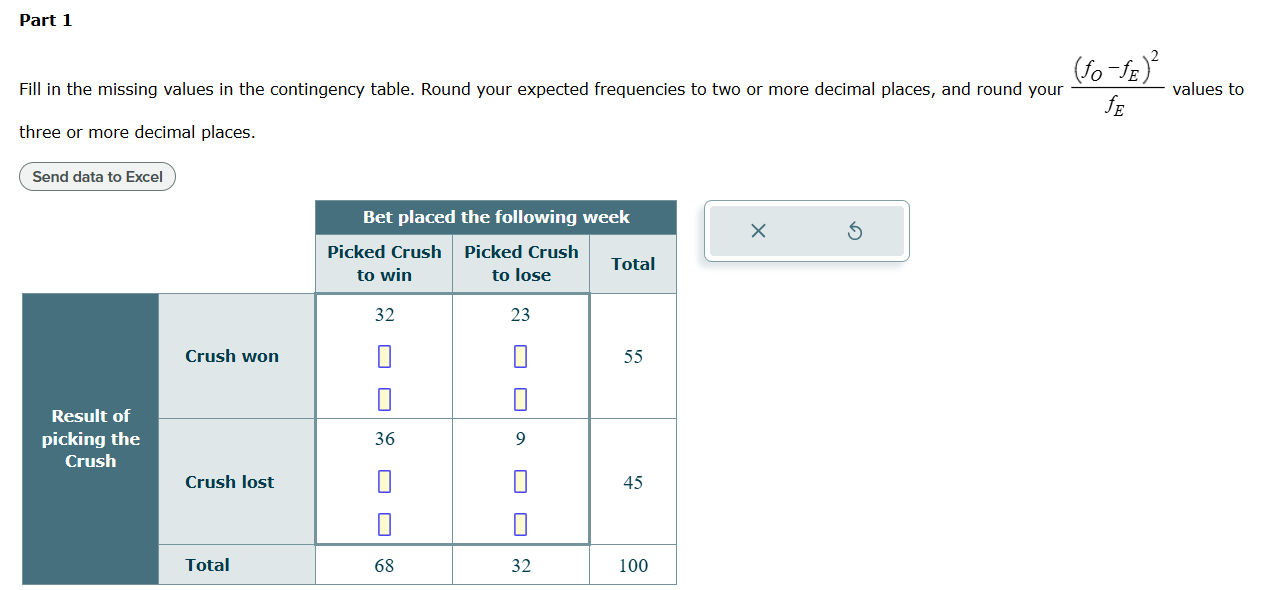
In an experimental study, researchers had each of the participants bet on each game of a professional football season. The contingency table below contains some
Step by Step Solution
There are 3 Steps involved in it
Step: 1

Get Instant Access to Expert-Tailored Solutions
See step-by-step solutions with expert insights and AI powered tools for academic success
Step: 2

Step: 3
Ace Your Homework with AI
Get the answers you need in no time with our AI-driven, step-by-step assistance
Get Started
Precalculus
Authors: Michael Sullivan
10th Global Edition
1292121772, 1292121777, 978-1292121772