Answered step by step
Verified Expert Solution
Link Copied!

Question

1 Approved Answer

In an Infrared Spectroscopy graph, the y-axis is typically labeled % transmittance. What does a peak on this sort of graph represent? The absorption of
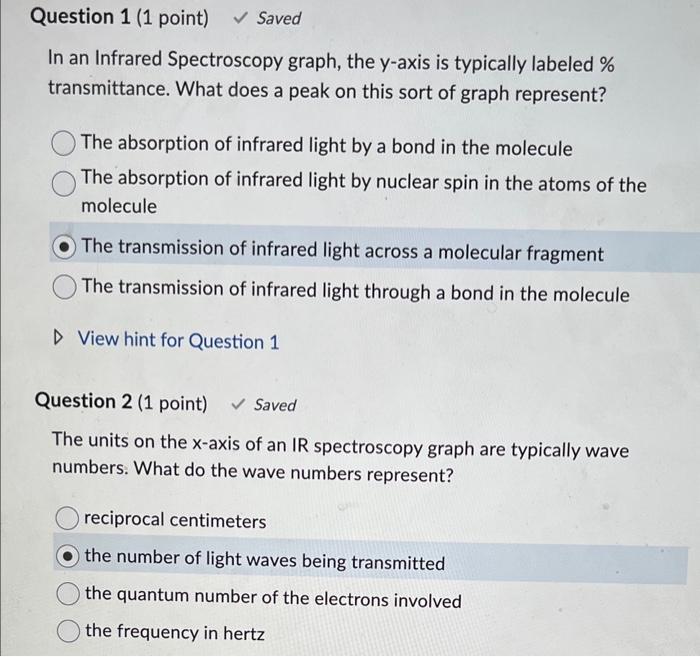
image text in transcribed
In an Infrared Spectroscopy graph, the y-axis is typically labeled \% transmittance. What does a peak on this sort of graph represent? The absorption of infrared light by a bond in the molecule The absorption of infrared light by nuclear spin in the atoms of the molecule The transmission of infrared light across a molecular fragment The transmission of infrared light through a bond in the molecule View hint for Question 1 Question 2 (1 point) Saved The units on the x-axis of an IR spectroscopy graph are typically wave numbers. What do the wave numbers represent? reciprocal centimeters the number of light waves being transmitted the quantum number of the electrons involved the frequency in hertz

Step by Step Solution

There are 3 Steps involved in it

Step: 1

blur-text-image

Get Instant Access to Expert-Tailored Solutions

See step-by-step solutions with expert insights and AI powered tools for academic success

Step: 2

blur-text-image_2

Step: 3

blur-text-image_3

Ace Your Homework with AI

Get the answers you need in no time with our AI-driven, step-by-step assistance

Get Started

Recommended Textbook for

Introduction To Chemical Engineering For Chemical Engineers And Students

Authors: Uche P. Nnaji

1st Edition

1119592100, 978-1119592105

More Books

Students also viewed these Chemical Engineering questions