

Question
In an investigation of environmental causes of disease, data were collected on the annual mortality rate (deaths per 100,000) for males in 61 large towns
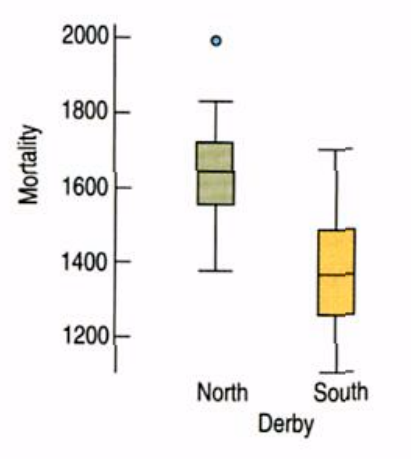
In an investigation of environmental causes of disease, data were collected on the annual mortality rate (deaths per 100,000) for males in 61 large towns in England and Wales. In addition, the water hardness was recorded as the calcium concentration (parts per million, ppm) in the drinking water. The data set also notes for each town whether it was south or north of Derby. Is there a significant difference in mortality rates in the two regions? Here are the summary statistics.
Summary of: mortality
For categories in: Derby
Group Count Mean Median StdDev
North 34 1631.59 1631 138.470
South 27 1388.85 1369 151.114
USE MINITAB:
a)Test appropriate hypotheses and state your
conclusion.
b)The boxplots of the two distributions show an
outlier among the data north of Derby. What effect
might that have had on your test?
Step by Step Solution
There are 3 Steps involved in it
Step: 1

Get Instant Access to Expert-Tailored Solutions
See step-by-step solutions with expert insights and AI powered tools for academic success
Step: 2

Step: 3
Ace Your Homework with AI
Get the answers you need in no time with our AI-driven, step-by-step assistance
Get Started
Mathematical Applications for the Management Life and Social Sciences
Authors: Ronald J. Harshbarger, James J. Reynolds
11th edition
9781337032247, 9781305465183, 1305108043, 1337032247, 1305465180, 978-1305108042