

Question
In April 1984, Royal Paper Corporation began discussing a possible sale of its linerboard assets to Atlantic Corporation. By acquiring these assets (Royal Papers Monticello
In April 1984, Royal Paper Corporation began discussing a possible sale of its linerboard assets to Atlantic Corporation. By acquiring these assets (Royal Papers Monticello linerboard-mill and 16 corrugated box plants), Atlantic would achieve an important strategic goal of increasing firm-wide linerboard capacity.
Atlantic Corporation
As one of the nations largest forest product/paper firms, Atlantic competed in three businesses: building products, paper and pulp, and chemicals. Two-thirds of its sales and operating profits stemmed from its building products division, which was the worlds largest producer of plywood. Sales and profits of forest products such as plywood are tied to construction activity, which in turn is very sensitive to interest rate fluctuations.
The Market for Linerboard
Linerboard, a stiffened paper product, is primarily transformed into corrugated cardboard boxes, which are used to pack most of U.S. goods shipped. Changes in the level of industrial production are closely tied to box shipments and linerboard sales. Like the building product industry, the linerboard industrys performance is closely tied to the overall economy, but less so. This is mainly because in periods of high interest rates, new home starts can be brought practically to a halt, but industrial production and the packaging of goods in boxes do not stop.
Analysts expected 1984 to be healthy for the linerboard industry. Strong demand, limited supply, and limited new capacity were expected to cause the industry to operate at nearly 100% utilization. Given the high fixed costs in the industry, high operating rates meant high profits. Linerboard and box sales were predicted to rise nearly 7%. Yet, only 1%-2% new capacity was expected before the end of 1986. Linerboard makers would therefore operate at historically high levels of production, with operating rates expected to increase to 99% and linerboard prices to top $420 per ton by the end of 1986.
Atlantic's Interest in Linerboard
Atlantic's intention to add linerboard capacity was well known. The firm's existing Toledo, Ohio linerboard mill produced 780 tons of linerboard per day. This being only 1.8% of domestic capacity, Atlantic could share in only a small way in the expected healthy market. More importantly, Atlantic was the only major paper producer that was a net buyer of linerboard. Atlantic purchased some 150,000 tons of linerboard each year from competitors to feed its box plants. Given the current tight market, linerboard could become available only at very high prices or even unavailable at all. Atlantic's box plants might be forced to turn away orders and the box division's profits could be eroded.
Atlantic had studied possible remedies. A new 2,000-daily-tons linerboard mill would cost $750M, require investing $60M in working capital, and take two years to build. With cash costs and interest rates at historic highs, this was not a valuable proposition. Other firms seemed to reach the same conclusion, as indicated by the lack of new linerboard plants in the industry.
Atlantic then rated (A, B or C) the existing U.S. linerboard mills depending on capacity, age, etc. Unlike business school students, many received a C. None of the owners of A-rated mills (including Royal whose Monticello mill was ranked as the fourth best in the country) were interested in selling. In late 1983, Atlantic bid for Continental Group's package of three linerboard mills, with a combined capacity of over 1.1 million tons per year (or 3,143 daily tons). However, Atlantic lost the bid to Stone Container Corp., whose product line consisted almost exclusively of linerboard and box products. According to Mr. Stone, the three mills were purchased for $112,500 per daily ton, excluding working capital and without assigning any value to the corrugated box plants included in the deal. This represented only about 30% of the cost of building new capacity, which could not be brought in for less than $375,000 per daily ton 2 years later.
The Royal Paper Package: Mill and Box Plants
The Monticello, Mississippi mill. Completed in 1968, the $121M state-of-the-art mill produced both linerboard and kraft paper (used to manufacture grocery bags). In December 1983, Royal announced a modernization plan, which involved spending $70-$80M over 20-22 months to convert the mill's kraft capacity to linerboard capacity. This would increase the mill's linerboard capacity from 661,000 to 747,000 annual tons (or 2,134 daily tons). Part of the output would be transformed into corrugated boxes in the 16 box plants, and the rest by Atlantic's own box plants. As of April 1984, the conversion process had not yet been started.
Corrugated box plants. Due to high shipping costs, box plants tended to be located near end-users. Royal Paper's 16 box plants location (South, Midwest, and East) made them almost ideally suited for a combination with Atlantic's plants (West, South, and Midwest) as together they would cover most major U.S. markets.
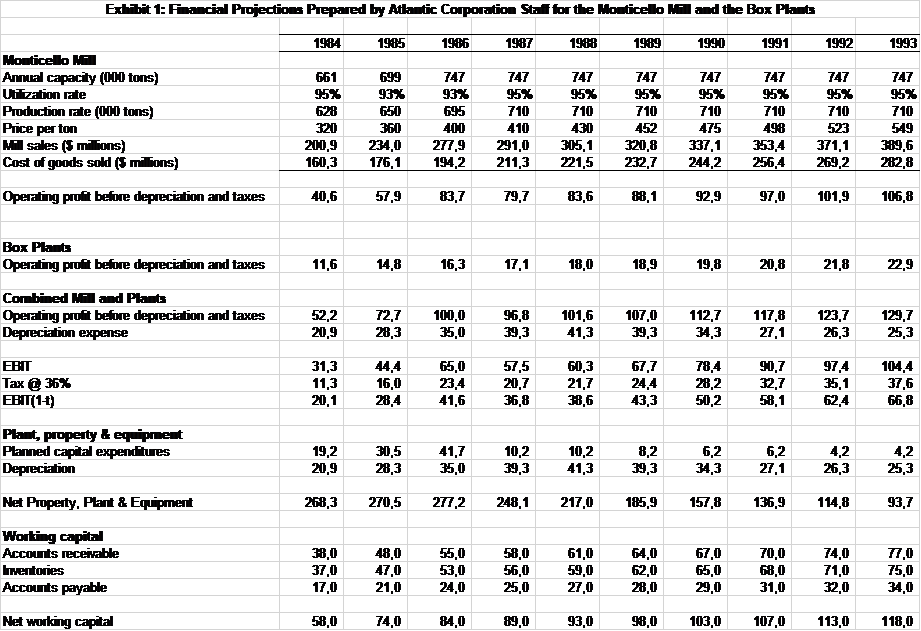
Exhibit 1 shows Atlantics forecast for the Monticello mill and the 16 box plants. Capital expenditures of about $140.8M would be incurred to convert the mill's kraft capacity to linerboard capacity, improve the plants' efficiency, and maintain the facilities. The mill and the plants would have a 10-year economic life (through 1993), at which time Atlantic would decide whether or not to maintain the operation by investing in new capacity to replace the mill and plants. No salvage value was expected at the end of their lives. The purchase would include net working capital of about $49M already in place.
Royal Paper Corporation
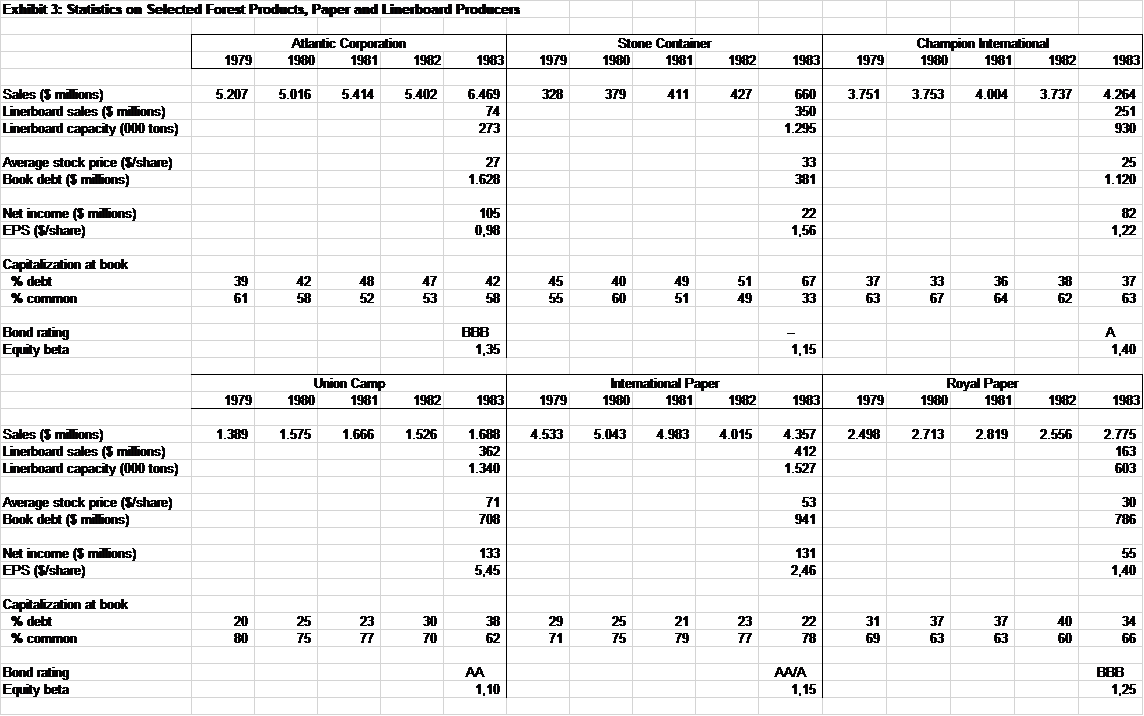
Over 1974-81, Royal Paper's sales and net profits grew at about 9% each year. However, the industry experienced a downturn in 1982-83. Royal Papers sales and profits fell, and in 1982, its stock price fell to a 15-year low. This downturn was precipitated by a weakening of Royal Paper's major forest product/paper markets and was offset by the stable performance of its printing papers division. In response, Royal Paper cut its workforce by 10% and divested itself of over a dozen money-losing mills.
Although Royal Papers stock had climbed back to the mid-30 dollar range by the end of 1983, its management was still under considerable pressure. In fact, Royal Papers interest in selling linerboard assets to Atlantic seemed linked to its recent dealings with significant shareholders. In February 1984, as Royal was recovering from the industry-wide slump, the Wall Street Journal reported "Royal Paper Seen Likely Takeover Target as Buyer Pays 2-Point Premium for Huge Block of Shares," and identified the buyer as Sir James Goldsmith, a reputed corporate raider. In March, Royal announced it had purchased Goldsmith's stock back from him at a substantial premium. Goldsmith's profit from the greenmail was rumored to be around $50M. Just days after the repurchase, Loews Corp., an insurance, hotel, entertainment, and tobacco company, was announced to have acquired 7.7% of Royal.
Atlantic's Financing
Atlantic thought Royal Paper's CEO was determined to protect the company's independence, and would use the proceeds from the sale to repurchase Loews's stake. But how much were the assets worth? Another issue was financing. The purchase would create financing pressures in addition to those projected for Atlantic without the purchase. With earnings depressed and raiders on the prowl, this was an important issue for Atlantic's management.
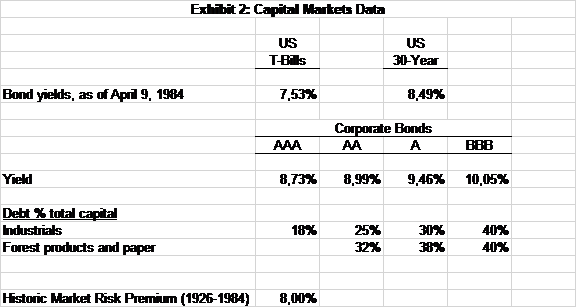
Atlantic had been investigating possible financing sources. While the financial markets had been volatile in the late 1970s and early 1980s, the situation in April 1984 was relatively calm. The stock market also seemed poised to move higher on the strength of a recovery in corporate earnings and further declines in interest rates (see Exhibit 2). In this environment, Atlantic could consider the following:
- Drawing on its bank credit line of $200M, which bore interest at the prime rate plus 1-1/2% (current prime rate, 9.25%);
- Issuing up to $400M of 25-year non-callable debentures at a yield of 10-1/4% to be repaid in equal installments over 10 years starting in the sixth year;
- Issuing up to $300M common stock at an estimated price of $30 per share with net proceeds to the company of $28 per share (current stock price, $32);
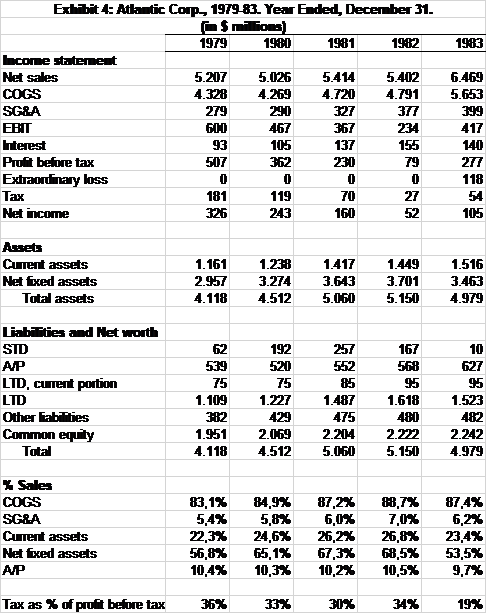
Atlantic's board of directors was concerned that its debt might slip further within the BBB category. Atlantic already had one of the lowest bond ratings among its major peer group competitors (see Exhibit 3).
Questions
It is essential that you state clearly all the assumptions you are making, and why you make them. Otherwise, grading becomes impossible and you will not get partial credit.
1) Estimate Atlantics valuation for the group of assets
- Estimate separately each of the components of the relevant WACC for the valuation, and the WACC itself. State explicitly the assumptions you are making, and why you are making them.
To make grading easier, use a 13% WACC for the rest of the case.
- Estimate separately (i) the relevant Free Cash Flows over the 1984-93 period and their present value, (ii) a terminal value, and (iii) the implied value for the assets. State all your assumptions explicitly.
Step by Step Solution
There are 3 Steps involved in it
Step: 1

Get Instant Access to Expert-Tailored Solutions
See step-by-step solutions with expert insights and AI powered tools for academic success
Step: 2

Step: 3
Ace Your Homework with AI
Get the answers you need in no time with our AI-driven, step-by-step assistance
Get Started
ISO 14010s Environmental Auditing Tools And Techniques For Passing Or Performing Environmental Audits
Authors: W. Lee Kuhre
1st Edition
0133802051, 978-0133802054