In C language please and thank you
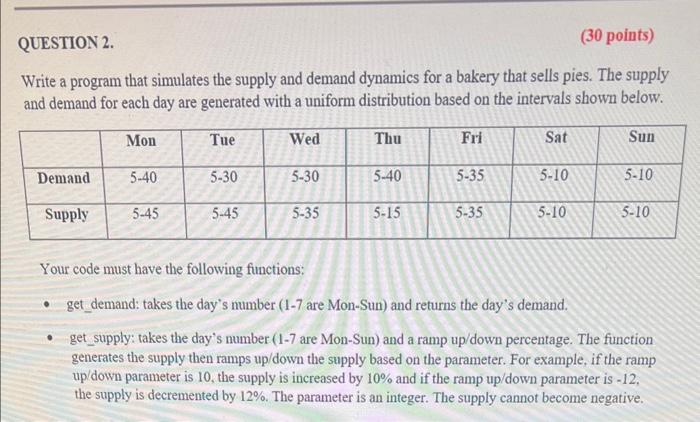
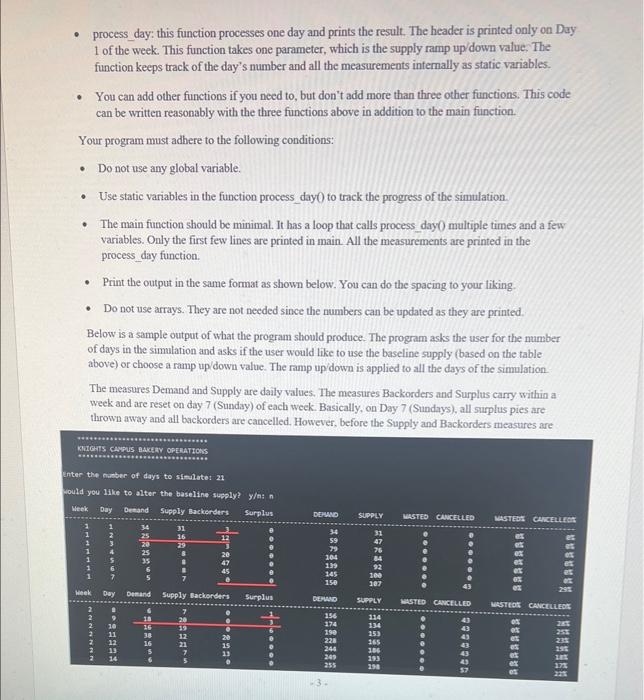
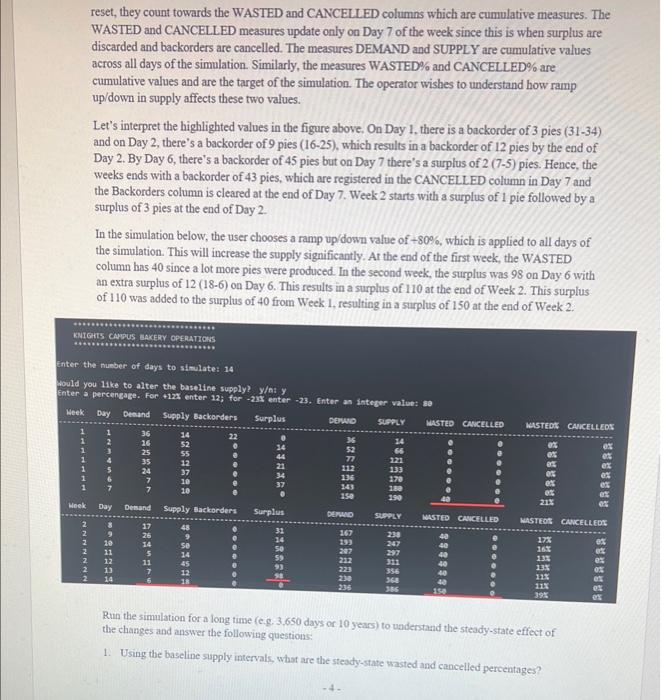
Write a program that simulates the supply and demand dynamics for a bakery that sells pies. The supply and demand for each day are generated with a uniform distribution based on the intervals shown below. Your code must have the following functions: - get_demand: takes the day's number (1-7 are Mon-Sun) and returns the day's demand. - get_supply: takes the day's number (1-7 are Mon-Sun) and a ramp up/down percentage. The function generates the supply then ramps up/down the supply based on the parameter. For example, if the ramp up/down parameter is 10 , the supply is increased by 10% and if the ramp up/down parameter is -12 , the supply is decremented by 12%. The parameter is an integer. The supply cannot become negative. - process day: this function processes one day and prints the result. The header is printed only on Day 1 of the week. This function takes one parameter, which is the supply ramp up/down value. The function keeps track of the day's number and all the measurements internally as static variables. - You can add other functions if you need to, but don't add more than three other functions. This code can be written reasonably with the three functions above in addition to the main function. Your program must adbere to the following conditions: - Do not use any global variable. - Use static variables in the function process_day0 to track the progress of the simulation. - The main function should be minimal. It has a loop that calls process day0 multiple times and a few variables. Only the first few lines are printed in main All the measurements are printed in the process day function. - Print the output in the same format as shown below. You can do the spacing to your liking. - Do not use arrays. They are not needed since the numbers can be updated as they are printed. Below is a sample output of what the program should produce. The program asks the user for the number of days in the simulation and asks if the user would like to use the baseline supply (based on the table above) or choose a ramp up/down value. The ramp up down is applied to all the days of the simulation. The measures Demand and Supply are daily values. The measures Backorders and Surplus carry within a week and are reset on day 7 (Sunday) of each week. Basically, on Day 7 (Sundays), all surplus pies are thrown away and all backorders are cancelled. However, before the Supply and Backorders measures are reset, they count towards the WASTED and CANCELLED columns which are cumulative measures. The WASTED and CANCELLED measures update only on Day 7 of the week since this is when surplus are discarded and backorders are cancelled. The measures DEMAND and SUPPLY are cumulative values across all days of the simulation. Similarly, the measures WASTED\% and CANCELLED\% are cumulative values and are the target of the simulation. The operator wishes to understand how ramp up/down in supply affects these two values. Let's interpret the highlighted values in the figure above, On Day 1, there is a backorder of 3 pies (31-34) and on Day 2, there's a backorder of 9 pies (16-25), which results in a backorder of 12 pies by the end of Day 2. By Day 6, there's a backorder of 45 pies but on Day 7 there's a surplus of 2(75) pies. Hence, the weeks ends with a backorder of 43 pies, which are registered in the CANCELLED column in Day 7 and the Backorders column is cleared at the end of Day 7 . Week 2 starts with a surplus of 1 pie followed by a surplus of 3 pies at the end of Day 2 . In the simulation below, the user chooses a ramp up/down value of +80%, which is applied to all days of the simulation. This will increase the supply significantly. Ar the end of the first week, the WASTED column has 40 since a lot more pies were produced. In the second week, the surplus was 98 on Day 6 with an extra surplus of 12 (18-6) on Day 6. This results in a surplus of 110 at the end of Week 2 . This surplus of 110 was added to the surplus of 40 from Week 1 , resulting in a surplus of 150 at the end of Week 2 . Run the simulation for a long time (eg, 3,650 days or 10 years) to understand the steady-state effect of the changes and answer the following questions: 1. Using the baseline supply intervals, what are the steady-state wasted and cancelled percentages? 2. What is the minimum ramp up in supply that results in the cancelled percentage to be 5% or lower? What would be the wasted percentage then? 3. What is the minimum ramp down in supply that results in the wasted percentage to be 5% or lower? What would be the cancelled percentage then? Below is a simple technique that prints aligned tabulated information. The term %6 s prints a phrase on 6 spaces and the term %6d prints an integer on 6 spaces right-justified. Notice how the printf statements match the spaces (6,5,8) so the format will be tabulated and aligned. printf("\%6d 85d%8d ", week_number, day_counter, demand)


