 in C programming. Thanks and appreciate.
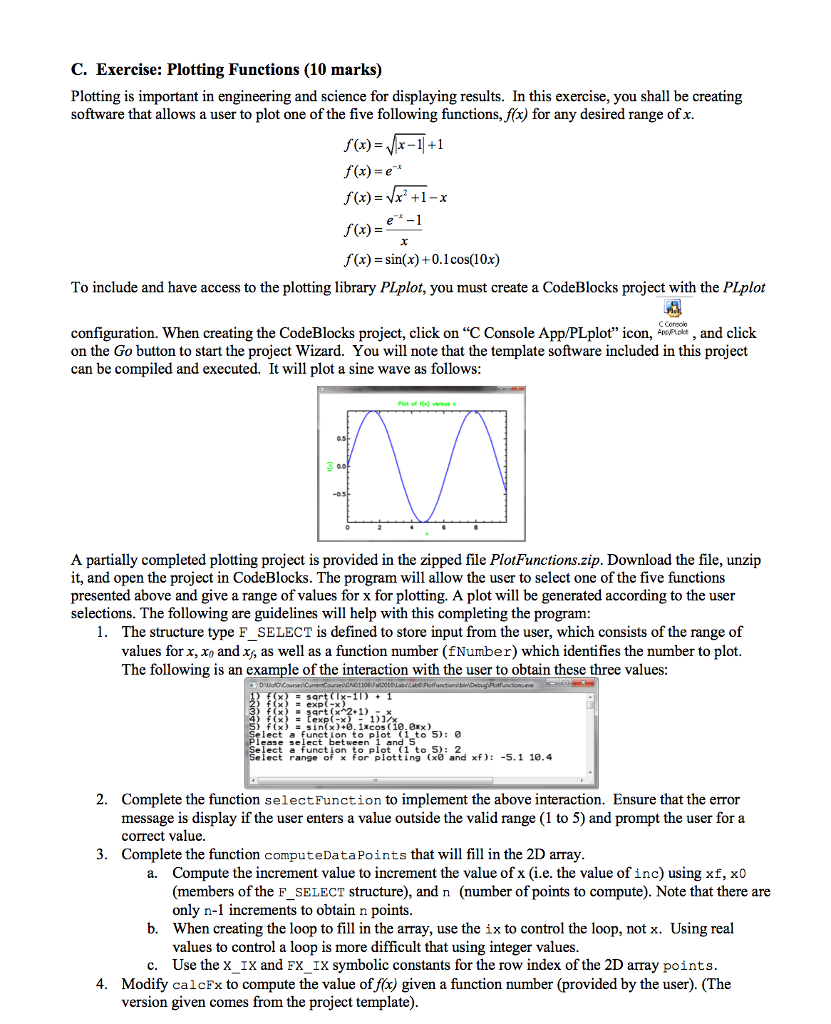
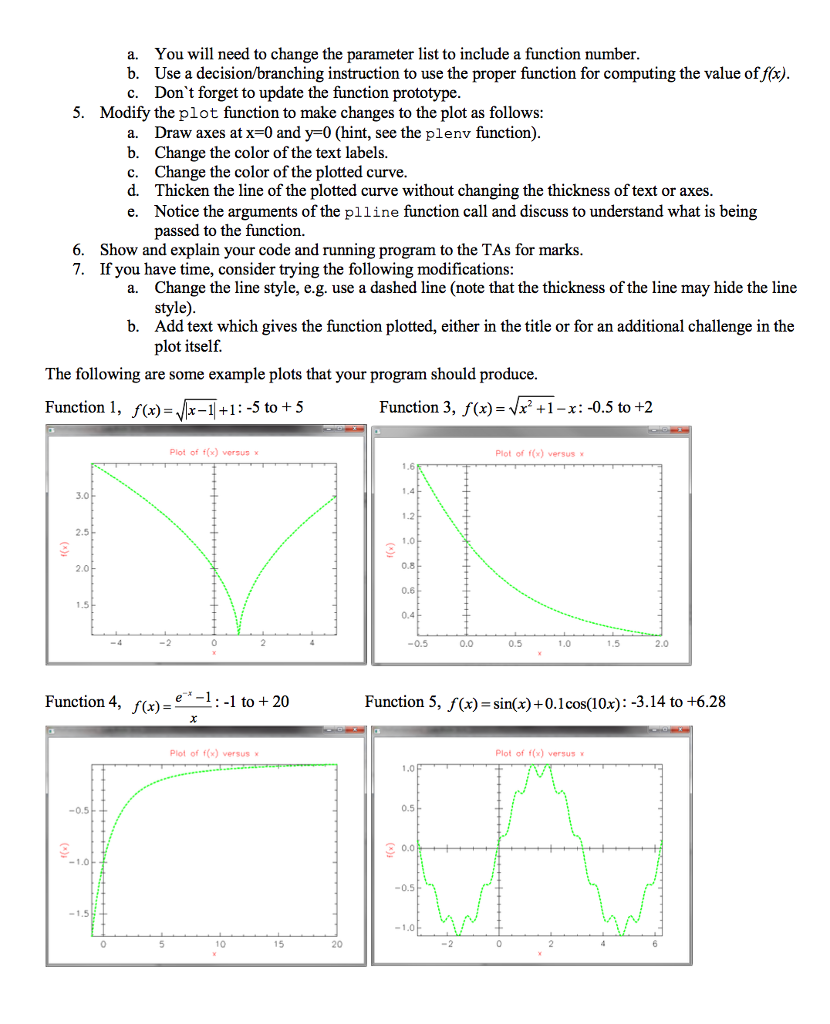
C. Exercise: Plotting Functions (10 marks) Plotting is important in engineering and science for displaying results. In this exercise, you shall be creating software that allows a user to plot one of the five following functions, f(x) for any desired range ofx. f(x)=e" f(x)-Vx' +1-x f(x) f(x)-sin(x) +0.1cos(10x) To include and have access to the plotting library PLplot, you must create a CodeBlocks project with the PLplot C Coreoe configuration. When creating the CodeBlocks project, click on "C Console App/PLplot" icon, *, and click on the Go button to start the project Wizard. You will note that the template software included in this project can be compiled and executed. It will plot a sine wave as follows A partially completed plotting project is provided in the zipped file PlotFunctions.zip. Download the file, unzip it, and open the project in CodeBlocks. The program will allow the user to select one of the five functions presented above and give a range of values for x for plotting. A plot will be generated according to the user selections. The following are guidelines will help with this completing the program: 1. The structure type F_SELECT is defined to store input from the user, which consists of the range of values for x, xo and x, as well as a function number (fNumber) which identifies the number to plot. The following is an example of the interaction with the user to obtain these three values: ) f(x) sqrt (> '2+1) - (x)sin(x)+0.1xcos (10.0xx) lect a function to plot (1to 5): e 5 lect a function to plot (1 to S): 2 lect range of x for plotting (x0 and xf)-5.1 18.4 2. Complete the function selectFunction to implement the above interaction. Ensure that the error message is display if the user enters a value outside the valid range (1 to 5) and prompt the user for a correct value. Complete the function computeDataPoints that will fill in the 2D array 3. a. Compute the increment value to increment the value of x (i.e. the value ofinc) using xf, x0 (members of the F_SELECT structure), and n (number of points to compute). Note that there are only n-1 increments to obtain n points When creating the loop to fill in the array, use the ix to control the loop, not x. Using real values to control a loop is more difficult that using integer values b. c. Use the x_IX and FX_IX symbolic constants for the row index of the 2D array points 4. Modify calcFx to compute the value of fc) given a function number (provided by the user). (The version given comes from the project template) C. Exercise: Plotting Functions (10 marks) Plotting is important in engineering and science for displaying results. In this exercise, you shall be creating software that allows a user to plot one of the five following functions, f(x) for any desired range ofx. f(x)=e" f(x)-Vx' +1-x f(x) f(x)-sin(x) +0.1cos(10x) To include and have access to the plotting library PLplot, you must create a CodeBlocks project with the PLplot C Coreoe configuration. When creating the CodeBlocks project, click on "C Console App/PLplot" icon, *, and click on the Go button to start the project Wizard. You will note that the template software included in this project can be compiled and executed. It will plot a sine wave as follows A partially completed plotting project is provided in the zipped file PlotFunctions.zip. Download the file, unzip it, and open the project in CodeBlocks. The program will allow the user to select one of the five functions presented above and give a range of values for x for plotting. A plot will be generated according to the user selections. The following are guidelines will help with this completing the program: 1. The structure type F_SELECT is defined to store input from the user, which consists of the range of values for x, xo and x, as well as a function number (fNumber) which identifies the number to plot. The following is an example of the interaction with the user to obtain these three values: ) f(x) sqrt (> '2+1) - (x)sin(x)+0.1xcos (10.0xx) lect a function to plot (1to 5): e 5 lect a function to plot (1 to S): 2 lect range of x for plotting (x0 and xf)-5.1 18.4 2. Complete the function selectFunction to implement the above interaction. Ensure that the error message is display if the user enters a value outside the valid range (1 to 5) and prompt the user for a correct value. Complete the function computeDataPoints that will fill in the 2D array 3. a. Compute the increment value to increment the value of x (i.e. the value ofinc) using xf, x0 (members of the F_SELECT structure), and n (number of points to compute). Note that there are only n-1 increments to obtain n points When creating the loop to fill in the array, use the ix to control the loop, not x. Using real values to control a loop is more difficult that using integer values b. c. Use the x_IX and FX_IX symbolic constants for the row index of the 2D array points 4. Modify calcFx to compute the value of fc) given a function number (provided by the user). (The version given comes from the project template)