

Answered step by step
Verified Expert Solution
Question
1 Approved Answer
In cell C 6 insert a Scatter Chart for the Price versus Living Area data from the Data worksheet. Inserting Chart Select the Scatter chart
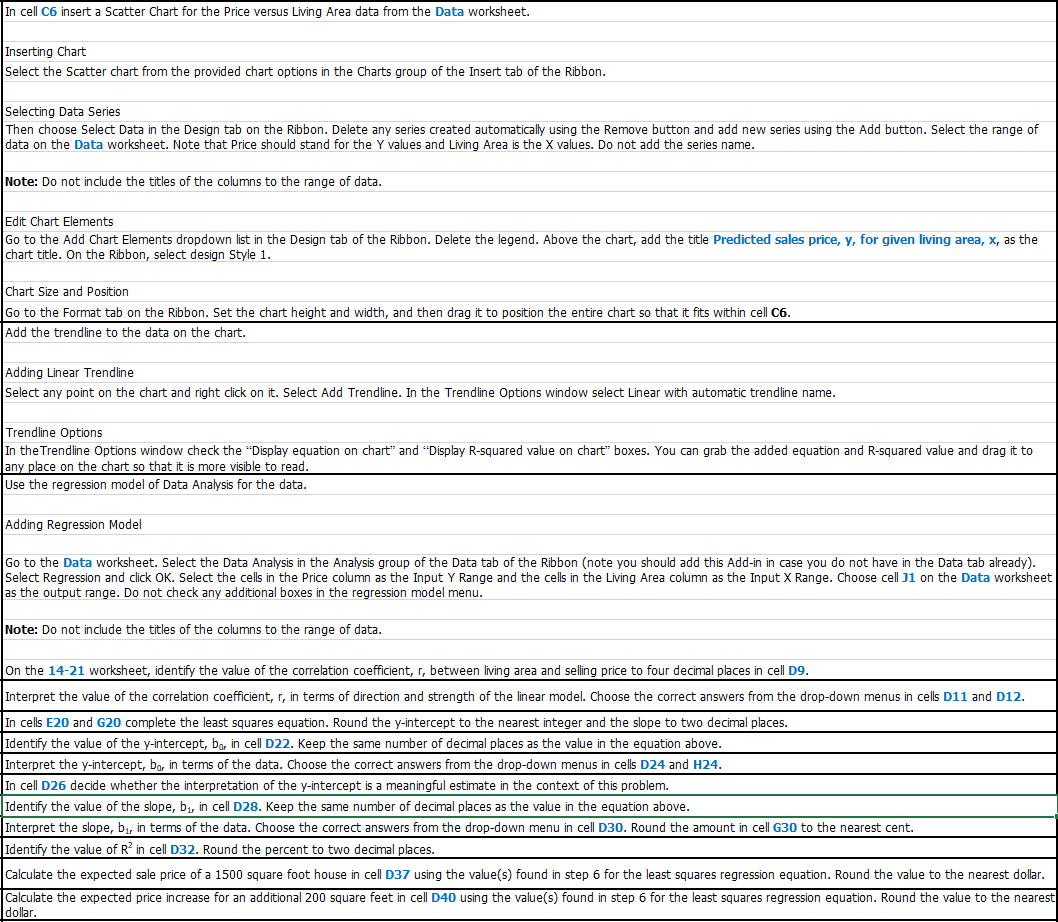
In cell C insert a Scatter Chart for the Price versus Living Area data from the Data worksheet.
Inserting Chart
Select the Scatter chart from the provided chart options in the Charts group of the Insert tab of the Ribbon.
Selecting Data Series
Then choose Select Data in the Design tab on the Ribbon. Delete any series created automatically using the Remove button and add new series using the Add button. Select the range of
data on the Data worksheet. Note that Price should stand for the Y values and Living Area is the values. Do not add the series name.
Note: Do not include the titles of the columns to the range of data.
Edit Chart Elements
Go to the Add Chart Elements dropdown list in the Design tab of the Ribbon. Delete the legend. Above the chart, add the title Predicted sales price, for given living area, as the
chart title. On the Ribbon, select design Style
Chart Size and Position
Go to the Format tab on the Ribbon. Set the chart height and width, and then drag it to position the entire chart so that it fits within cell C
Add the trendline to the data on the chart.
Adding Linear Trendline
Select any point on the chart and right click on it Select Add Trendline. In the Trendline Options window select Linear with automatic trendline name.
Trendline Options
In theTrendline Options window check the "Display equation on chart" and "Display Rsquared value on chart" boxes. You can grab the added equation and Rsquared value and drag it to
any place on the chart so that it is more visible to read.
Use the regression model of Data Analysis for the data.
Adding Regression Model
Go to the Data worksheet. Select the Data Analysis in the Analysis group of the Data tab of the Ribbon note you should add this Addin in case you do not have in the Data tab already
Select Regression and click OK Select the cells in the Price column as the Input Y Range and the cells in the Living Area column as the Input X Range. Choose cell J on the Data worksheet
as the output range. Do not check any additional boxes in the regression model menu.
Note: Do not include the titles of the columns to the range of data.
On the worksheet, identify the value of the correlation coefficient, between living area and selling price to four decimal places in cell D
Interpret the value of the correlation coefficient, in terms of direction and strength of the linear model. Choose the correct answers from the dropdown menus in cells D and D
In cells E and G complete the least squares equation. Round the yintercept to the nearest integer and the slope to two decimal places.
Identify the value of the intercept, in cell D Keep the same number of decimal places as the value in the equation above.
Interpret the intercept, in terms of the data. Choose the correct answers from the dropdown menus in cells D and H
In cell D decide whether the interpretation of the yintercept is a meaningful estimate in the context of this problem.
Identify the value of the slope, in cell D Keep the same number of decimal places as the value in the equation above.
Interpret the slope, in terms of the data. Choose the correct answers from the dropdown menu in cell D Round the amount in cell G to the nearest cent.
Identify the value of in cell Round the percent to two decimal places.
Calculate the expected sale price of a square foot house in cell D using the values found in step for the least squares regression equation. Round the value to the nearest dollar.
Calculate the expected price increase for an additional square feet in cell D using the values found in step for the least squares regression equation. Round the value to the nearest
dollar.
Step by Step Solution
There are 3 Steps involved in it
Step: 1

Get Instant Access to Expert-Tailored Solutions
See step-by-step solutions with expert insights and AI powered tools for academic success
Step: 2

Step: 3
Ace Your Homework with AI
Get the answers you need in no time with our AI-driven, step-by-step assistance
Get Started
Current Trends In Database Technology Edbt 2004 Workshops Edbt 2004 Workshops Phd Datax Pim P2panddb And Clustweb Heraklion Crete Greece March 2004 Revised Selected Papers Lncs 3268
Authors: Wolfgang Lindner ,Marco Mesiti ,Can Turker ,Yannis Tzitzikas ,Athena Vakali
2005th Edition
3540233059, 978-3540233053