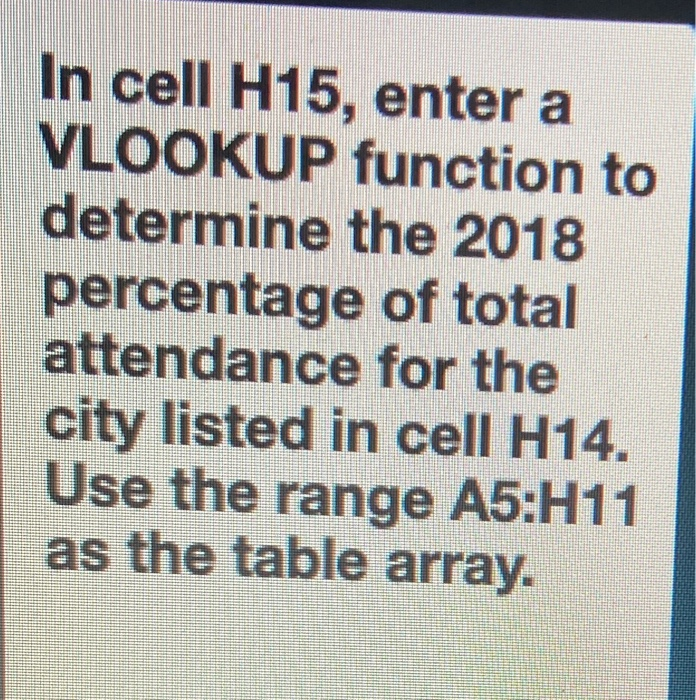
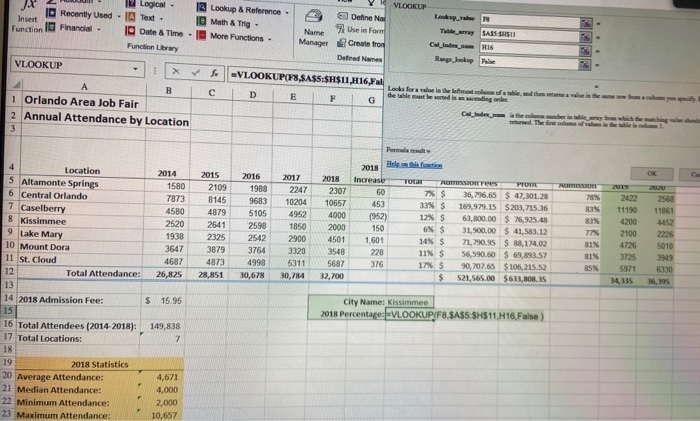
In cell H15, enter a VLOOKUP function to determine the 2018 percentage of total attendance for the city listed in cell H14. Use the range A5:H11 as the table array. VLOOKUP Logical- Lookup & Reference Recently Used - A Text Math & Trg - Function 10 Financial - I Date & Time - More Functions Function Library AX Insert Define Na Name Use in Form Manager Create from Defined Names The SAS SSI C.de 16 Rape Jockey VLOOKUP =VLOOKUP(78 SA$5:5H$11, H16,Fal Lalatanthiratadt.alsaesa D E the table mulete sending order F G B 1 Orlando Area Job Fair 2 Annual Attendance by Location 3 red. The first Herre 2018 OK 2015 2109 8145 4879 2641 2325 3879 4873 28,851 2016 1988 9683 5105 2598 2542 3764 4998 30,678 2017 2247 10204 4952 1850 83% 83% 2018 2307 10657 4000 2000 4501 3548 5687 32,700 Helesfunctie Increase TURI ANOTTE PTUTTE 60 7% $ 36,796.65 $ 47,301.28 453 33% $ 169,979.15 $203,715.36 (952) 12% $ 63,800.00 $ 76,925.48 150 6% $ 31,900.00 $ 41.583.12 1,601 71,790,95 $ 88,114.02 228 113 S 56,590.60 $ 69,893,57 376 17% 90,707.65 $ 106, 215.52 $ 521,565.00 $633,808.35 2900 10% $ 2422 11190 4200 2100 4726 3725 5971 34,115 81% 81% 85% 2568 11861 4452 2226 5010 3919 6330 36,395 3320 5311 30,784 4 Location 2014 5 Altamonte Springs 1580 6 Central Orlando 7873 7 Caselberry 4580 8 Kissimmee 2520 9 Lake Mary 1938 10 Mount Dora 3647 11 St. Cloud 4687 12 Total Attendance: 26,825 13 14 2018 Admission Fee: $15.95 15 16 Total Attendees (2014-2018): 149,838 17 Total Locations: 7 18 19 2018 Statistics 20 Average Attendance: 4,671 21 Median Attendance: 4,000 22 Minimum Attendance: 2,000 23 Maximum Attendance: 10,657 City Name: Kissimmee 2018 Percentage:-VLOOKUP{F8, SA$5:SH$11.16.False)