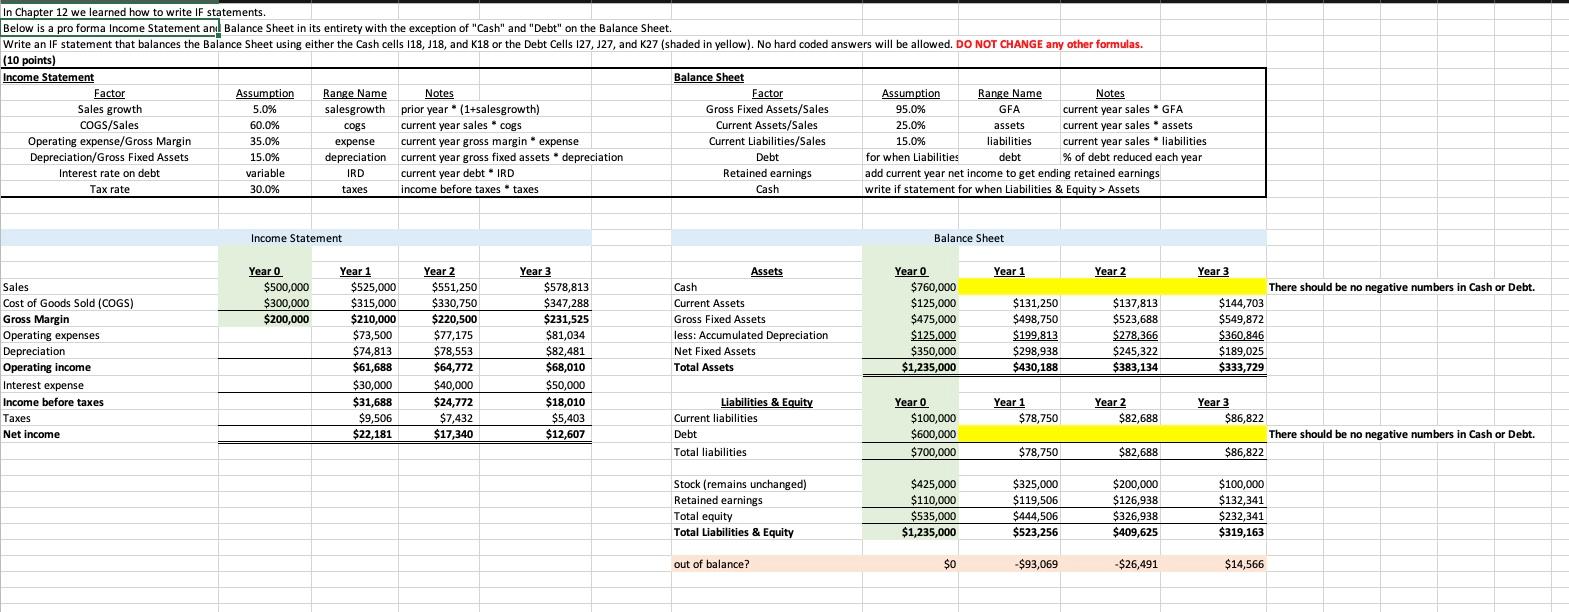
In Chapter 12 we learned how to write IF statements. Below is a pro forma Income Statement and Balance Sheet in its entirety with the exception of "Cash" and "Debt" on the Balance Sheet. Write an IF statement that balances the Balance Sheet using either the Cash cells 118, 118, and K18 or the Debt Cells 127, 127, and K27 (shaded in yellow). No hard coded answers will be allowed. DO NOT CHANGE any other formulas. (10 points) Income Statement Balance Sheet Factor Assumption Range Name Notes Factor Assumption Range Name Notes Sales growth 5.0% salesgrowth prior year *(1+salesgrowth) Gross Fixed Assets/Sales 95.0% GFA current year sales GFA COGS/Sales 60.0% cogs current year salescogs Current Assets/Sales 25.0% assets current year sales assets Operating expense/Gross Margin 35.0% expense current year gross marginexpense Current Liabilities/Sales 15.0% liabilities current year sales liabilities Depreciation/Gross Fixed Assets 15.0% depreciation current year gross fixed assets depreciation Debt for when Liabilities debt % of debt reduced each year % Interest rate on debt variable IRD current year debt. IRD Retained earnings current year net income to get ending retained earnings Tax rate 30.0% taxes income before taxes taxes Cash write if statement for when Liabilities & Equity > Assets Income Statement Balance Sheet Year 1 Year 2 Year 0 $760,000 Year 0 $500,000 $300,000 $200,000 $125,000 Sales Cost of Goods Sold (COGS) Gross Margin Operating expenses Depreciation Operating income Interest expense Income before taxes Taxes Net income $475,000 Year 1 $525,000 $315,000 $210,000 $73,500 $74,813 $61,688 $30,000 $31,688 $9,506 $22,181 Year 2 $551,250 $330,750 $220,500 $77,175 $78,553 $ $40,000 $24,772 $7,432 $17,340 Year 3 $578,813 $347,288 $231,525 $81,034 $82,481 $68,010 $50,000 $18,010 $5,403 $12,607 Assets Cash Current Assets Gross Fixed Assets less: Accumulated Depreciation Net Fixed Assets Total Assets $131,250 $498,750 $199.813 $298,938 $430,188 $125,000 $350,000 $1,235,000 Year 3 There should be no negative numbers in Cash or Debt. $144,703 $549,872 $360,846 $189,025 $333,729 $137,813 $523,688 $278,366 $245,322 $383,134 Liabilities & Equity Current liabilities Debt Year 1 $78,750 Year 2 $82,688 Year 3 $86,822 Year 0 $100,000 $600,000 $700,000 There should be no negative numbers in Cash or Debt. Total liabilities $78,750 $82,688 $86,822 Stock (remains unchanged) Retained earnings Total equity Total Liabilities & Equity $425,000 $110,000 $535,000 $1,235,000 $325,000 $119,506 $444,506 $523,256 $200,000 $126,938 $326,938 $409,625 $100,000 $132,341 $232,341 $319,163 out of balance? $0 $93,069 -$26,491 $14,566 In Chapter 12 we learned how to write IF statements. Below is a pro forma Income Statement and Balance Sheet in its entirety with the exception of "Cash" and "Debt" on the Balance Sheet. Write an IF statement that balances the Balance Sheet using either the Cash cells 118, 118, and K18 or the Debt Cells 127, 127, and K27 (shaded in yellow). No hard coded answers will be allowed. DO NOT CHANGE any other formulas. (10 points) Income Statement Balance Sheet Factor Assumption Range Name Notes Factor Assumption Range Name Notes Sales growth 5.0% salesgrowth prior year *(1+salesgrowth) Gross Fixed Assets/Sales 95.0% GFA current year sales GFA COGS/Sales 60.0% cogs current year salescogs Current Assets/Sales 25.0% assets current year sales assets Operating expense/Gross Margin 35.0% expense current year gross marginexpense Current Liabilities/Sales 15.0% liabilities current year sales liabilities Depreciation/Gross Fixed Assets 15.0% depreciation current year gross fixed assets depreciation Debt for when Liabilities debt % of debt reduced each year % Interest rate on debt variable IRD current year debt. IRD Retained earnings current year net income to get ending retained earnings Tax rate 30.0% taxes income before taxes taxes Cash write if statement for when Liabilities & Equity > Assets Income Statement Balance Sheet Year 1 Year 2 Year 0 $760,000 Year 0 $500,000 $300,000 $200,000 $125,000 Sales Cost of Goods Sold (COGS) Gross Margin Operating expenses Depreciation Operating income Interest expense Income before taxes Taxes Net income $475,000 Year 1 $525,000 $315,000 $210,000 $73,500 $74,813 $61,688 $30,000 $31,688 $9,506 $22,181 Year 2 $551,250 $330,750 $220,500 $77,175 $78,553 $ $40,000 $24,772 $7,432 $17,340 Year 3 $578,813 $347,288 $231,525 $81,034 $82,481 $68,010 $50,000 $18,010 $5,403 $12,607 Assets Cash Current Assets Gross Fixed Assets less: Accumulated Depreciation Net Fixed Assets Total Assets $131,250 $498,750 $199.813 $298,938 $430,188 $125,000 $350,000 $1,235,000 Year 3 There should be no negative numbers in Cash or Debt. $144,703 $549,872 $360,846 $189,025 $333,729 $137,813 $523,688 $278,366 $245,322 $383,134 Liabilities & Equity Current liabilities Debt Year 1 $78,750 Year 2 $82,688 Year 3 $86,822 Year 0 $100,000 $600,000 $700,000 There should be no negative numbers in Cash or Debt. Total liabilities $78,750 $82,688 $86,822 Stock (remains unchanged) Retained earnings Total equity Total Liabilities & Equity $425,000 $110,000 $535,000 $1,235,000 $325,000 $119,506 $444,506 $523,256 $200,000 $126,938 $326,938 $409,625 $100,000 $132,341 $232,341 $319,163 out of balance? $0 $93,069 -$26,491 $14,566