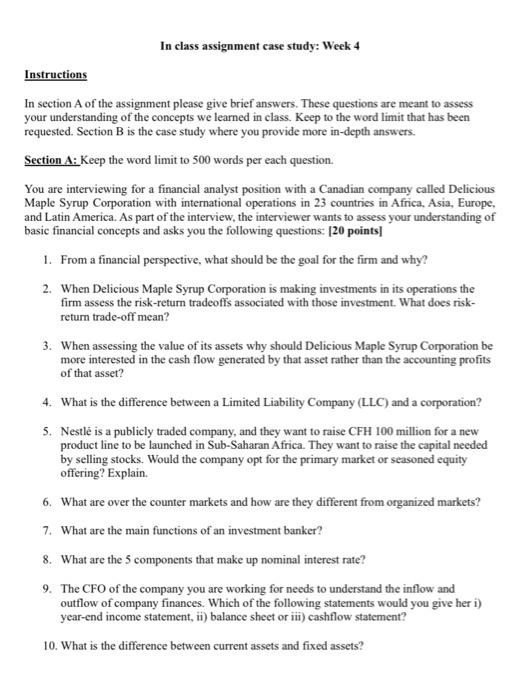
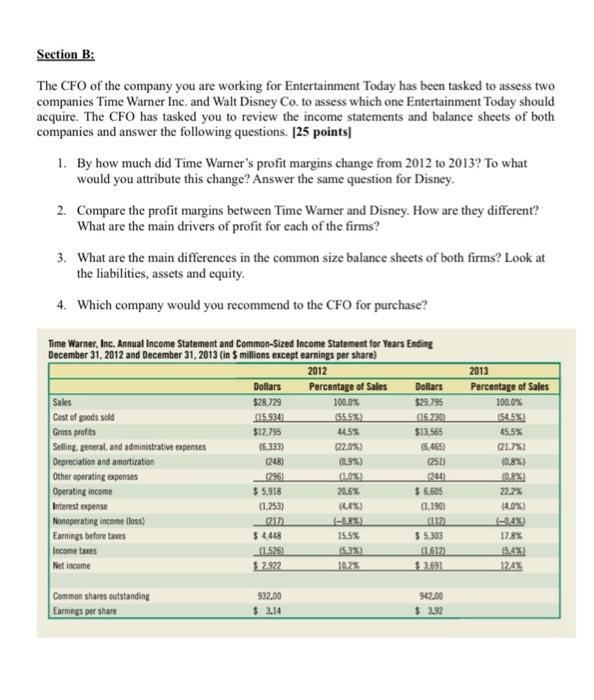
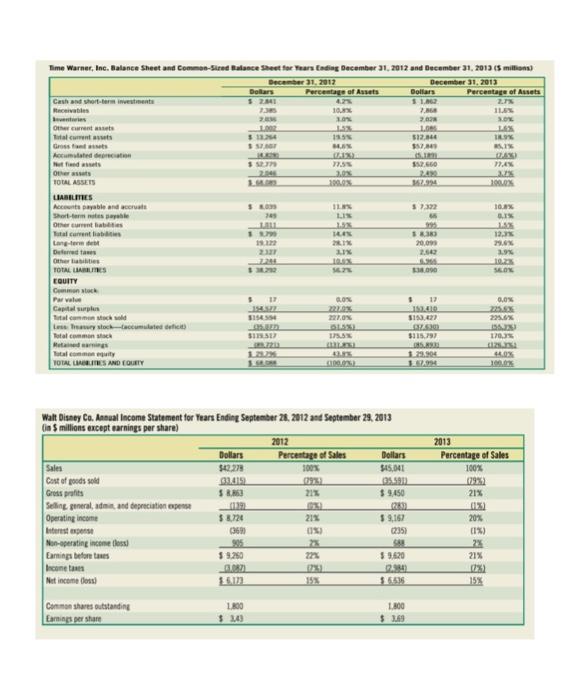
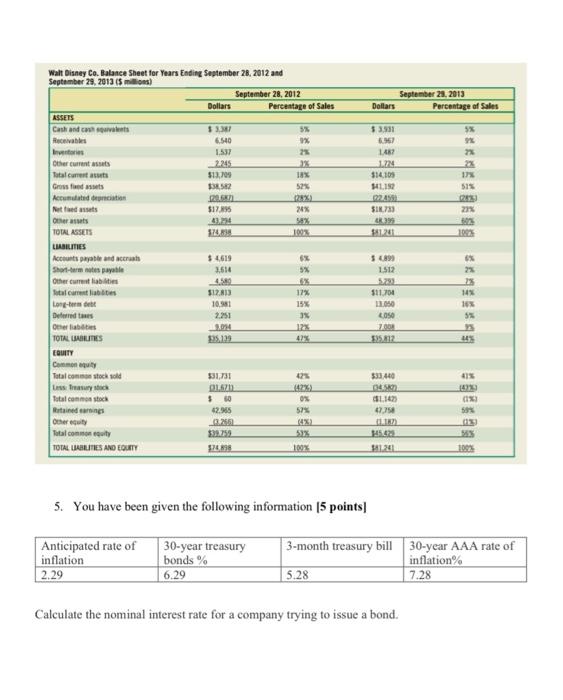
In class assignment case study: Week 4 Instructions In section A of the assignment please give brief answers. These questions are meant to assess your understanding of the concepts we learned in class. Keep to the word limit that has been requested. Section B is the case study where you provide more in-depth answers. Section A: Keep the word limit to 500 words per each question. You are interviewing for a financial analyst position with a Canadian company called Delicious Maple Syrup Corporation with international operations in 23 countries in Africa, Asia, Europe, and Latin America. As part of the interview, the interviewer wants to assess your understanding of basic financial concepts and asks you the following questions: [20 points] 1. From a financial perspective, what should be the goal for the firm and why? 2. When Delicious Maple Syrup Corporation is making investments in its operations the firm assess the risk-return tradeoffs associated with those investment. What does risk- return trade-off mean? 3. When assessing the value of its assets why should Delicious Maple Syrup Corporation be more interested in the cash flow generated by that asset rather than the accounting profits of that asset? 4. What is the difference between a Limited Liability Company (LLC) and a corporation? 5. Nestl is a publicly traded company, and they want to raise CFH 100 million for a new product line to be launched in Sub-Saharan Africa. They want to raise the capital needed by selling stocks. Would the company opt for the primary market or seasoned equity offering? Explain. 6. What are over the counter markets and how are they different from organized markets? 7. What are the main functions of an investment banker? 8. What are the 5 components that make up nominal interest rate? 9. The CFO of the company you are working for needs to understand the inflow and outflow of company finances. Which of the following statements would you give her i) year-end income statement, ii) balance sheet or iii) cashflow statement? 10. What is the difference between current assets and fixed assets? Section B: The CFO of the company you are working for Entertainment Today has been tasked to assess two companies Time Warner Inc. and Walt Disney Co. to assess which one Entertainment Today should acquire. The CFO has tasked you to review the income statements and balance sheets of both companies and answer the following questions. [25 points] 1. By how much did Time Warner's profit margins change from 2012 to 2013? To what would you attribute this change? Answer the same question for Disney. 2. Compare the profit margins between Time Warner and Disney. How are they different? What are the main drivers of profit for each of the firms? 3. What are the main differences in the common size balance sheets of both firms? Look at the liabilities, assets and equity. 4. Which company would you recommend to the CFO for purchase? Time Warner, Inc. Annual Income Statement and Common-Sized Income Statement for Years Ending December 31, 2012 and December 31, 2013 (in $ millions except earnings per share) 2012 2013 Dollars Percentage of Sales Dollars Percentage of Sales Sales $28,729 100.0% $29,795 100.0% Cost of goods sold (15.934) (55.5%) (16.230) (54.5%) Gross profits $12,795 44.5% $13.565 45.5% Selling, general, and administrative expenses (22.0%) (21.7%) Depreciation and amortization (0.9%) (0.8%) (1.025) Other operating expenses Operating income 20,6% 22.2% Interest expense (4,4%) (4.0%) Nonoperating income (loss) (-0.4%) Earnings before taxes 15.5% 17.8% Income taxes (5.4%) Net income 10.2% 12.4% Common shares outstanding Earnings per share (6,333) (248) (296) $ 5,918 (1,253) (217) $4,448 $2.922 932.00 $ 3.14 (5.465) (251) (244) $6,605 (1,190) (112) $5,303 (1.612) $3.691 942.00 $ 3.92 Time Warner, Inc. Balance Sheet and Common-Sized Balance Sheet for Years Ending December 31, 2012 and December 31, 2013 (5 millions) December 31, 2012 December 31, 2013 Percentage of Assets Dollars $ 2.341 Percentage of Assets 4.2% Dollars $ 1,862 Cash and short-term investments 2.7% 11,6% Receivables 7.385 10,8% 7,868 2,028 eventies 2.835 1.0% 3.0% Other current assets 1002 1.3% Los LAX Total current assets $ 19.5% $12,844 18.9% Gross fand assets 1 STAG MAX $57,849 85,1% Accumulated depreciation (LAX) (5.18 (74%) Not find assets $ 52.779 77.5% $52.660 77,4% Other assets 3.0% 2.490 3.7% 2.046 1.4.M TOTAL ASSETS 100.0% 167.994 100.0% LIABILITIES $ 8.000 11.8% $7,322 10.8% 249 Accounts payable and accruats Short-term nites payable Other current liabilities LIN 8.1% LILL 995 14% $ 5.799 14.4% $8.383 12,3% Total current liabilities Long-term deb 19.322 28.1% 20.099 29.4% Deferred tas 2.327 3.1% 2,542 3.9% Other abilities AMS 10.23 $34.292 16.7% $38.090 16.0% TOTAL LIABILITIES EQUITY Common stock Par value $ 17 0.0% $ 17 0.0% Capital surplus 227.2% 153.410 725.43 Total common stock sold $154.554 227.0% $153,427 225.6% Less Treasury stock-(accumulated deficit) OLANI (37.630 Total common stack $119.517 175.5% $115,797 (5533) 170.3% (125.352 Retained earnings HILFEL Total common equity 1.225. 44,0% 100.05 TOTAL LIABLITRES AND EQUITY (100,0%) Walt Disney Co. Annual Income Statement for Years Ending September 28, 2012 and September 29, 2013 (in $ millions except earnings per share) 2012 Dollars Percentage of Sales Dollars Percentage of Sales Sales $42.278 100% $45,041 100% Cost of goods sold (79%) (35.591) (79%) Gross profits $8.863 21% $9,450 21% Selling, general, admin, and depreciation expense (139) (283) Operating income $8,724 21% $9,167 Interest expense (235) Non-operating income (less) SAR Earnings before taxes $9.620 Income taxes Net income (oss) Common shares outstanding Earnings per share (369) 905 $ 9,260 01.087) .6.173 1.800 $ 3,43 12.264 14.8281 (1%) 22% (75) (2.384) $ 6636 1.800 $ 3.69 085.8931 1.29.904 1.67.994 2013 (13) 20% (1%) 2% 21% (7%) 15% Walt Disney Co. Balance Sheet for Years Ending September 28, 2012 and September 29, 2013 (5 millions) September 28, 2012 Dollars Percentage of Sales Dollars ASSETS Cash and cash squivalents $3,387 5% $ 3,531 Receivables 6.540 1% 6.967 Inventories 1.537 2% 1,487 Other current assets 2.245 225 1.724 Tatal current assets $13,709 18% $14,109 Gross fixed assets $38,582 52% $41.192 Accumulated depreciation $20.687) (2826) 22.459) Net faed assets $17,895 24% $18.733 Other assets 43.294 4K 399 TOTAL ASSETS $74.838 100% $81.241 LIABILITIES Accounts payable and accruals $ 4,619 6% $4,899 Short-term nates payable 3,614 5% 1.512 Other current liabilities 4.580 5.293 Total current liabilities $12.813 17% $11,704 Long-term de 10,981 15% 13.050 Deferred taxes 2.251 3% 4,050 Other liabilities 9.094 12% 7.008 TOTAL LIABILITIES 125.139 47% 325.812 EQUITY Common equity Total common stock sold $31,731 42% $33,440 Less Treasury stock 01671 (472) 04.587 Total common stock $60 0% ($1.142) Retained earnings 42.965 57% 47,758 Other equity (3.265) Total common equity $39.759 53% 145.425 TOTAL LIABILITIES AND EQUITY $74.898 100% $81.241 100% 5. You have been given the following information [5 points] Anticipated rate of 3-month treasury bill 30-year treasury bonds % 6.29 30-year AAA rate of inflation% inflation 2.29 5.28 7.28 Calculate the nominal interest rate for a company trying to issue a bond. September 29, 2013 Percentage of Sales ********* ******** 5% 2% 2% 17% 51% 23% 100% 2% 14% 16% 5% 44% 41% (4220) (18) 59% (39) In class assignment case study: Week 4 Instructions In section A of the assignment please give brief answers. These questions are meant to assess your understanding of the concepts we learned in class. Keep to the word limit that has been requested. Section B is the case study where you provide more in-depth answers. Section A: Keep the word limit to 500 words per each question. You are interviewing for a financial analyst position with a Canadian company called Delicious Maple Syrup Corporation with international operations in 23 countries in Africa, Asia, Europe, and Latin America. As part of the interview, the interviewer wants to assess your understanding of basic financial concepts and asks you the following questions: [20 points] 1. From a financial perspective, what should be the goal for the firm and why? 2. When Delicious Maple Syrup Corporation is making investments in its operations the firm assess the risk-return tradeoffs associated with those investment. What does risk- return trade-off mean? 3. When assessing the value of its assets why should Delicious Maple Syrup Corporation be more interested in the cash flow generated by that asset rather than the accounting profits of that asset? 4. What is the difference between a Limited Liability Company (LLC) and a corporation? 5. Nestl is a publicly traded company, and they want to raise CFH 100 million for a new product line to be launched in Sub-Saharan Africa. They want to raise the capital needed by selling stocks. Would the company opt for the primary market or seasoned equity offering? Explain. 6. What are over the counter markets and how are they different from organized markets? 7. What are the main functions of an investment banker? 8. What are the 5 components that make up nominal interest rate? 9. The CFO of the company you are working for needs to understand the inflow and outflow of company finances. Which of the following statements would you give her i) year-end income statement, ii) balance sheet or iii) cashflow statement? 10. What is the difference between current assets and fixed assets? Section B: The CFO of the company you are working for Entertainment Today has been tasked to assess two companies Time Warner Inc. and Walt Disney Co. to assess which one Entertainment Today should acquire. The CFO has tasked you to review the income statements and balance sheets of both companies and answer the following questions. [25 points] 1. By how much did Time Warner's profit margins change from 2012 to 2013? To what would you attribute this change? Answer the same question for Disney. 2. Compare the profit margins between Time Warner and Disney. How are they different? What are the main drivers of profit for each of the firms? 3. What are the main differences in the common size balance sheets of both firms? Look at the liabilities, assets and equity. 4. Which company would you recommend to the CFO for purchase? Time Warner, Inc. Annual Income Statement and Common-Sized Income Statement for Years Ending December 31, 2012 and December 31, 2013 (in $ millions except earnings per share) 2012 2013 Dollars Percentage of Sales Dollars Percentage of Sales Sales $28,729 100.0% $29,795 100.0% Cost of goods sold (15.934) (55.5%) (16.230) (54.5%) Gross profits $12,795 44.5% $13.565 45.5% Selling, general, and administrative expenses (22.0%) (21.7%) Depreciation and amortization (0.9%) (0.8%) (1.025) Other operating expenses Operating income 20,6% 22.2% Interest expense (4,4%) (4.0%) Nonoperating income (loss) (-0.4%) Earnings before taxes 15.5% 17.8% Income taxes (5.4%) Net income 10.2% 12.4% Common shares outstanding Earnings per share (6,333) (248) (296) $ 5,918 (1,253) (217) $4,448 $2.922 932.00 $ 3.14 (5.465) (251) (244) $6,605 (1,190) (112) $5,303 (1.612) $3.691 942.00 $ 3.92 Time Warner, Inc. Balance Sheet and Common-Sized Balance Sheet for Years Ending December 31, 2012 and December 31, 2013 (5 millions) December 31, 2012 December 31, 2013 Percentage of Assets Dollars $ 2.341 Percentage of Assets 4.2% Dollars $ 1,862 Cash and short-term investments 2.7% 11,6% Receivables 7.385 10,8% 7,868 2,028 eventies 2.835 1.0% 3.0% Other current assets 1002 1.3% Los LAX Total current assets $ 19.5% $12,844 18.9% Gross fand assets 1 STAG MAX $57,849 85,1% Accumulated depreciation (LAX) (5.18 (74%) Not find assets $ 52.779 77.5% $52.660 77,4% Other assets 3.0% 2.490 3.7% 2.046 1.4.M TOTAL ASSETS 100.0% 167.994 100.0% LIABILITIES $ 8.000 11.8% $7,322 10.8% 249 Accounts payable and accruats Short-term nites payable Other current liabilities LIN 8.1% LILL 995 14% $ 5.799 14.4% $8.383 12,3% Total current liabilities Long-term deb 19.322 28.1% 20.099 29.4% Deferred tas 2.327 3.1% 2,542 3.9% Other abilities AMS 10.23 $34.292 16.7% $38.090 16.0% TOTAL LIABILITIES EQUITY Common stock Par value $ 17 0.0% $ 17 0.0% Capital surplus 227.2% 153.410 725.43 Total common stock sold $154.554 227.0% $153,427 225.6% Less Treasury stock-(accumulated deficit) OLANI (37.630 Total common stack $119.517 175.5% $115,797 (5533) 170.3% (125.352 Retained earnings HILFEL Total common equity 1.225. 44,0% 100.05 TOTAL LIABLITRES AND EQUITY (100,0%) Walt Disney Co. Annual Income Statement for Years Ending September 28, 2012 and September 29, 2013 (in $ millions except earnings per share) 2012 Dollars Percentage of Sales Dollars Percentage of Sales Sales $42.278 100% $45,041 100% Cost of goods sold (79%) (35.591) (79%) Gross profits $8.863 21% $9,450 21% Selling, general, admin, and depreciation expense (139) (283) Operating income $8,724 21% $9,167 Interest expense (235) Non-operating income (less) SAR Earnings before taxes $9.620 Income taxes Net income (oss) Common shares outstanding Earnings per share (369) 905 $ 9,260 01.087) .6.173 1.800 $ 3,43 12.264 14.8281 (1%) 22% (75) (2.384) $ 6636 1.800 $ 3.69 085.8931 1.29.904 1.67.994 2013 (13) 20% (1%) 2% 21% (7%) 15% Walt Disney Co. Balance Sheet for Years Ending September 28, 2012 and September 29, 2013 (5 millions) September 28, 2012 Dollars Percentage of Sales Dollars ASSETS Cash and cash squivalents $3,387 5% $ 3,531 Receivables 6.540 1% 6.967 Inventories 1.537 2% 1,487 Other current assets 2.245 225 1.724 Tatal current assets $13,709 18% $14,109 Gross fixed assets $38,582 52% $41.192 Accumulated depreciation $20.687) (2826) 22.459) Net faed assets $17,895 24% $18.733 Other assets 43.294 4K 399 TOTAL ASSETS $74.838 100% $81.241 LIABILITIES Accounts payable and accruals $ 4,619 6% $4,899 Short-term nates payable 3,614 5% 1.512 Other current liabilities 4.580 5.293 Total current liabilities $12.813 17% $11,704 Long-term de 10,981 15% 13.050 Deferred taxes 2.251 3% 4,050 Other liabilities 9.094 12% 7.008 TOTAL LIABILITIES 125.139 47% 325.812 EQUITY Common equity Total common stock sold $31,731 42% $33,440 Less Treasury stock 01671 (472) 04.587 Total common stock $60 0% ($1.142) Retained earnings 42.965 57% 47,758 Other equity (3.265) Total common equity $39.759 53% 145.425 TOTAL LIABILITIES AND EQUITY $74.898 100% $81.241 100% 5. You have been given the following information [5 points] Anticipated rate of 3-month treasury bill 30-year treasury bonds % 6.29 30-year AAA rate of inflation% inflation 2.29 5.28 7.28 Calculate the nominal interest rate for a company trying to issue a bond. September 29, 2013 Percentage of Sales ********* ******** 5% 2% 2% 17% 51% 23% 100% 2% 14% 16% 5% 44% 41% (4220) (18) 59% (39)