IN DESPERATE NEED OF HELP FOR THIS PROJECT.
TRIED TO GET IT TO WORK AND MY REGRESSION IN EXCEL WOULDNT.
PLEASE HELP
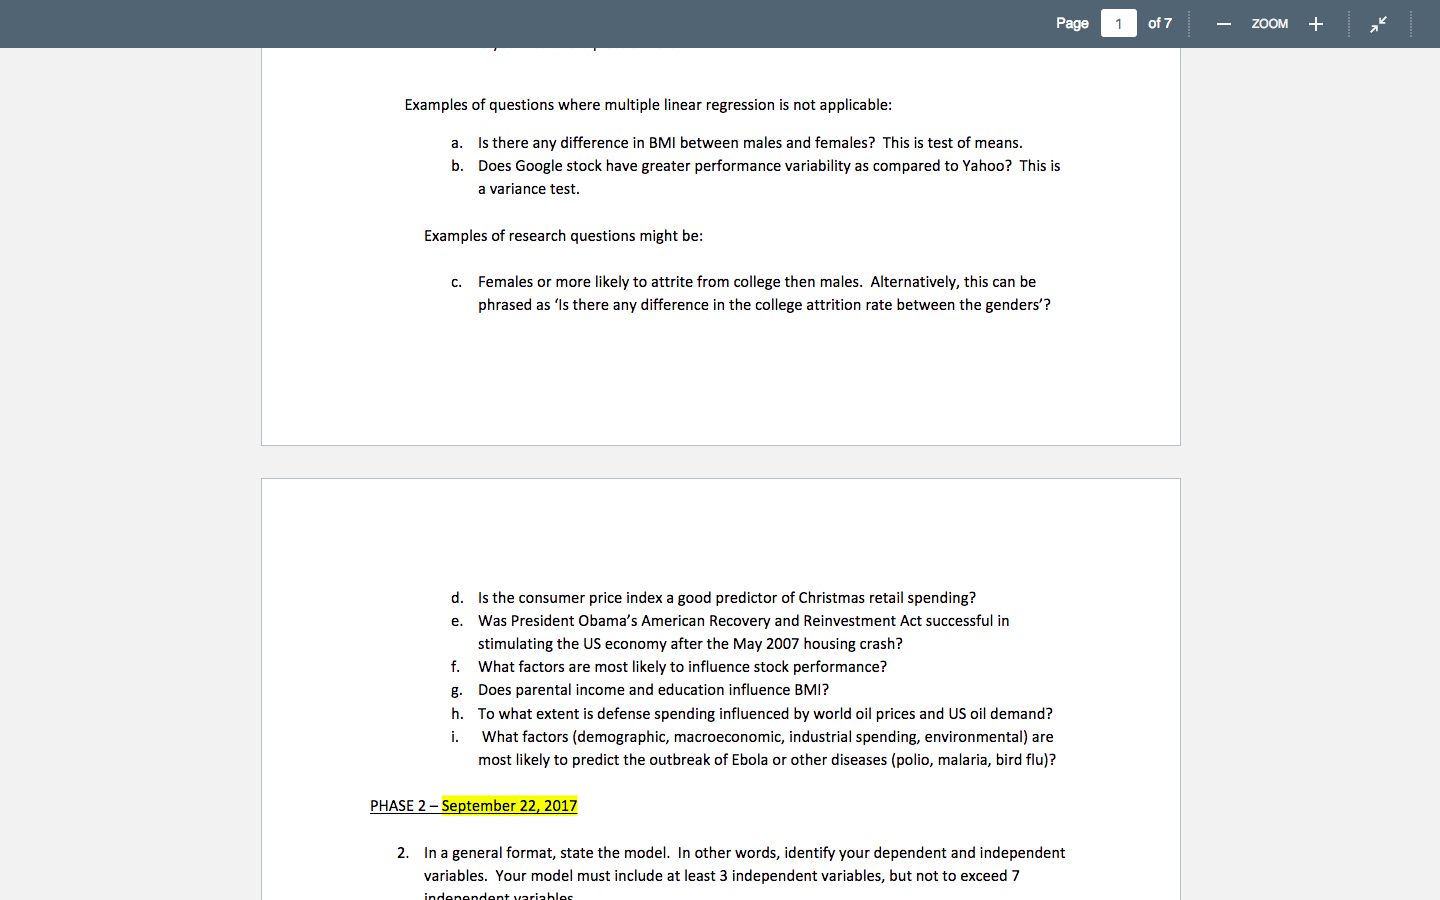
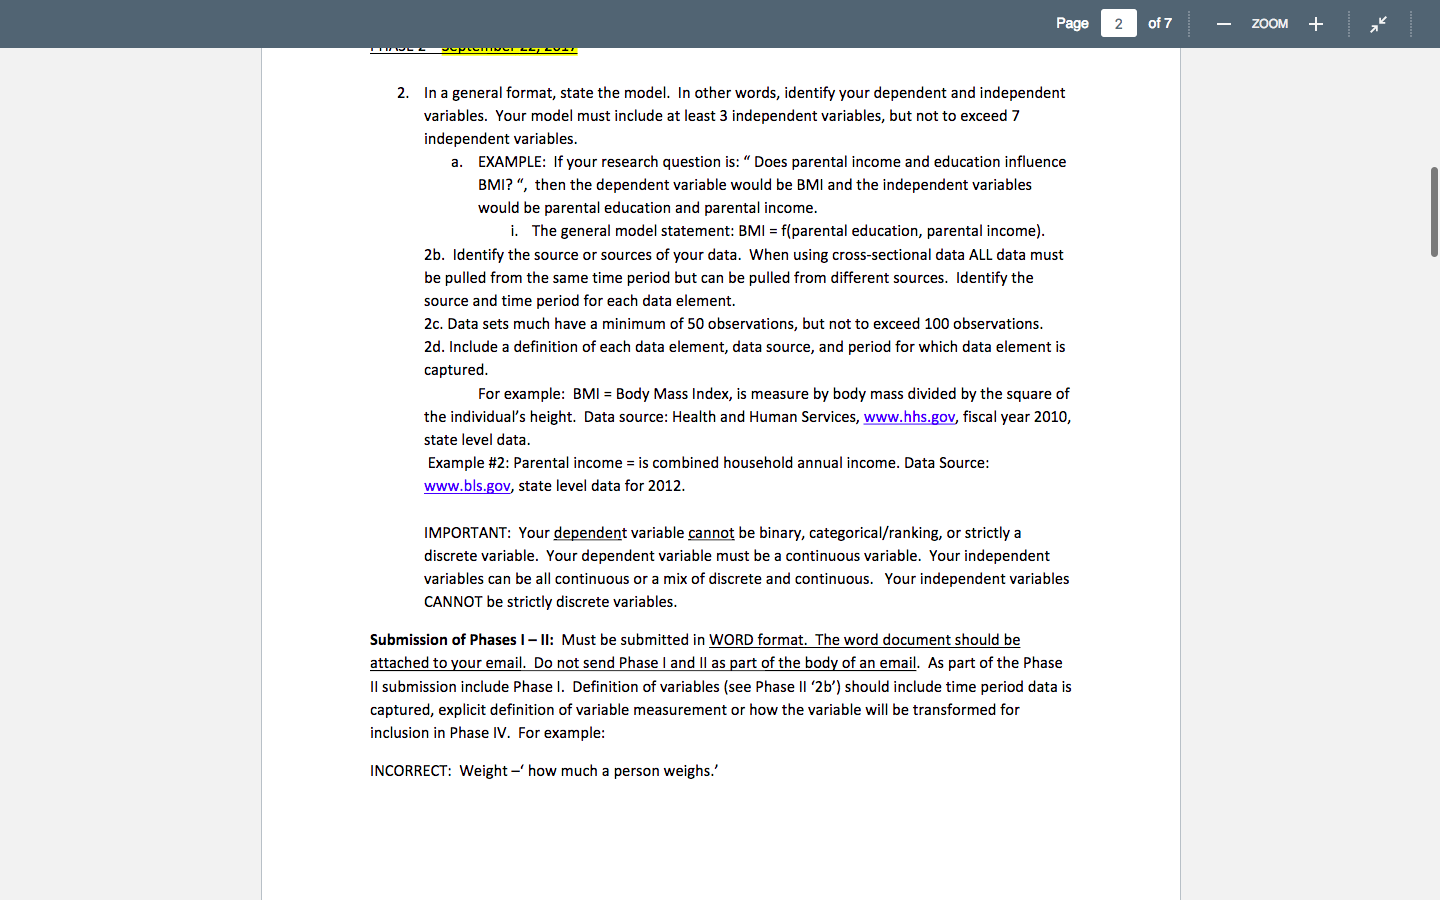
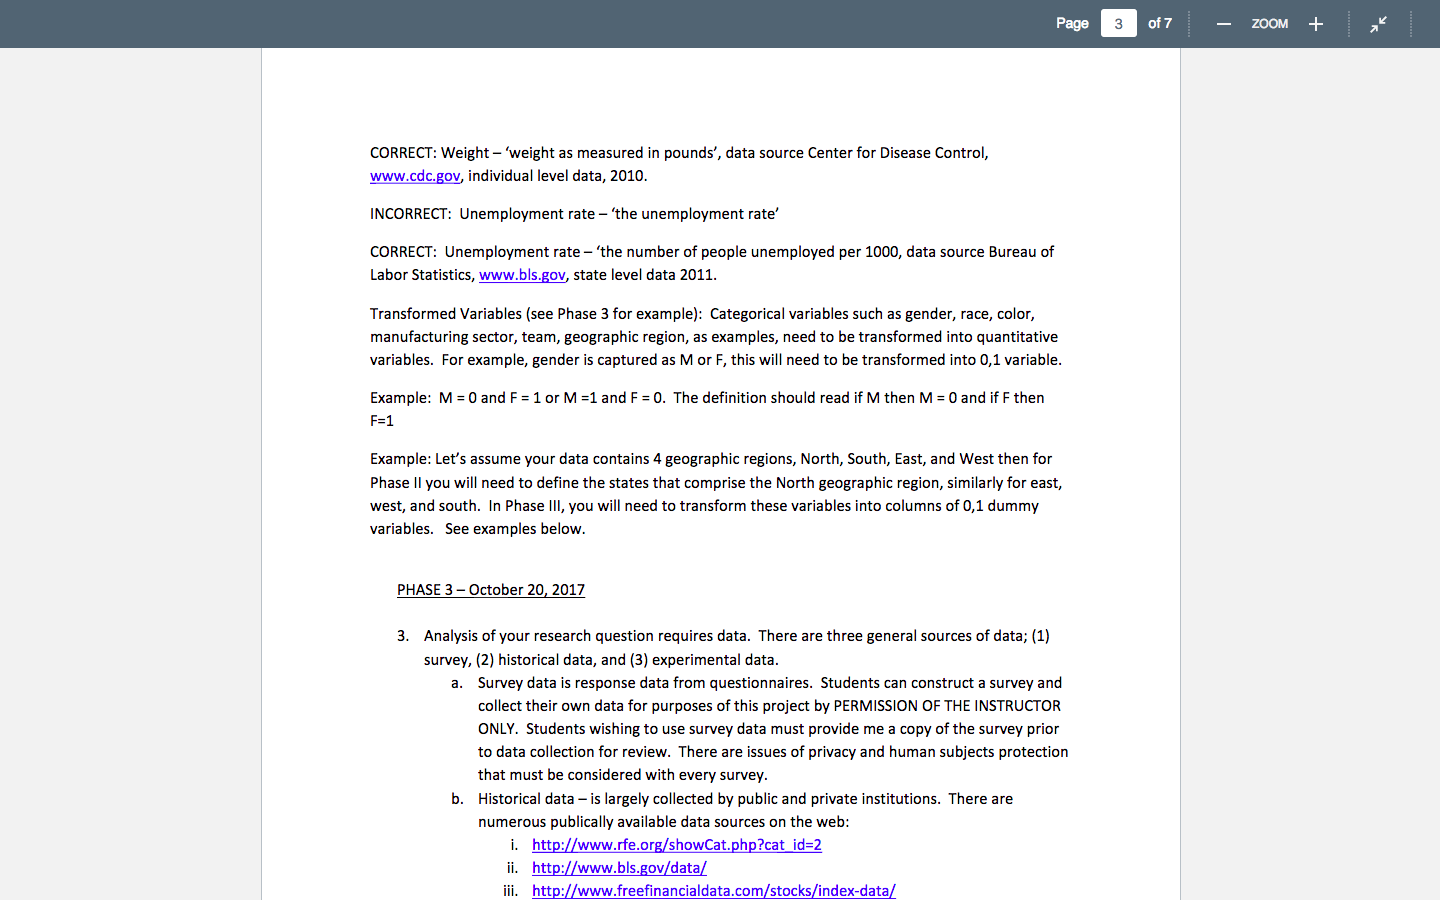
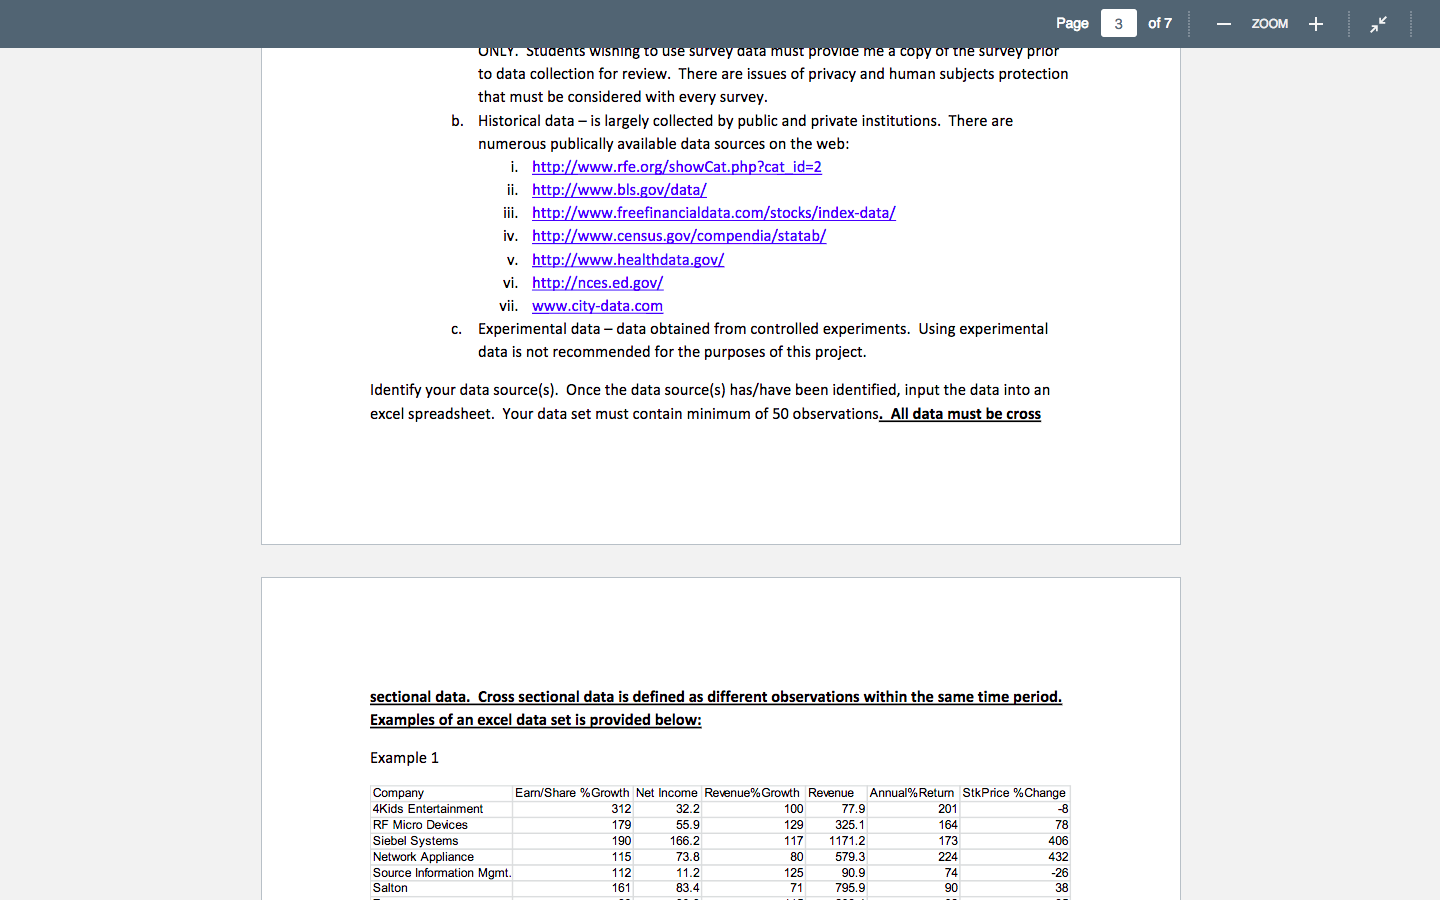
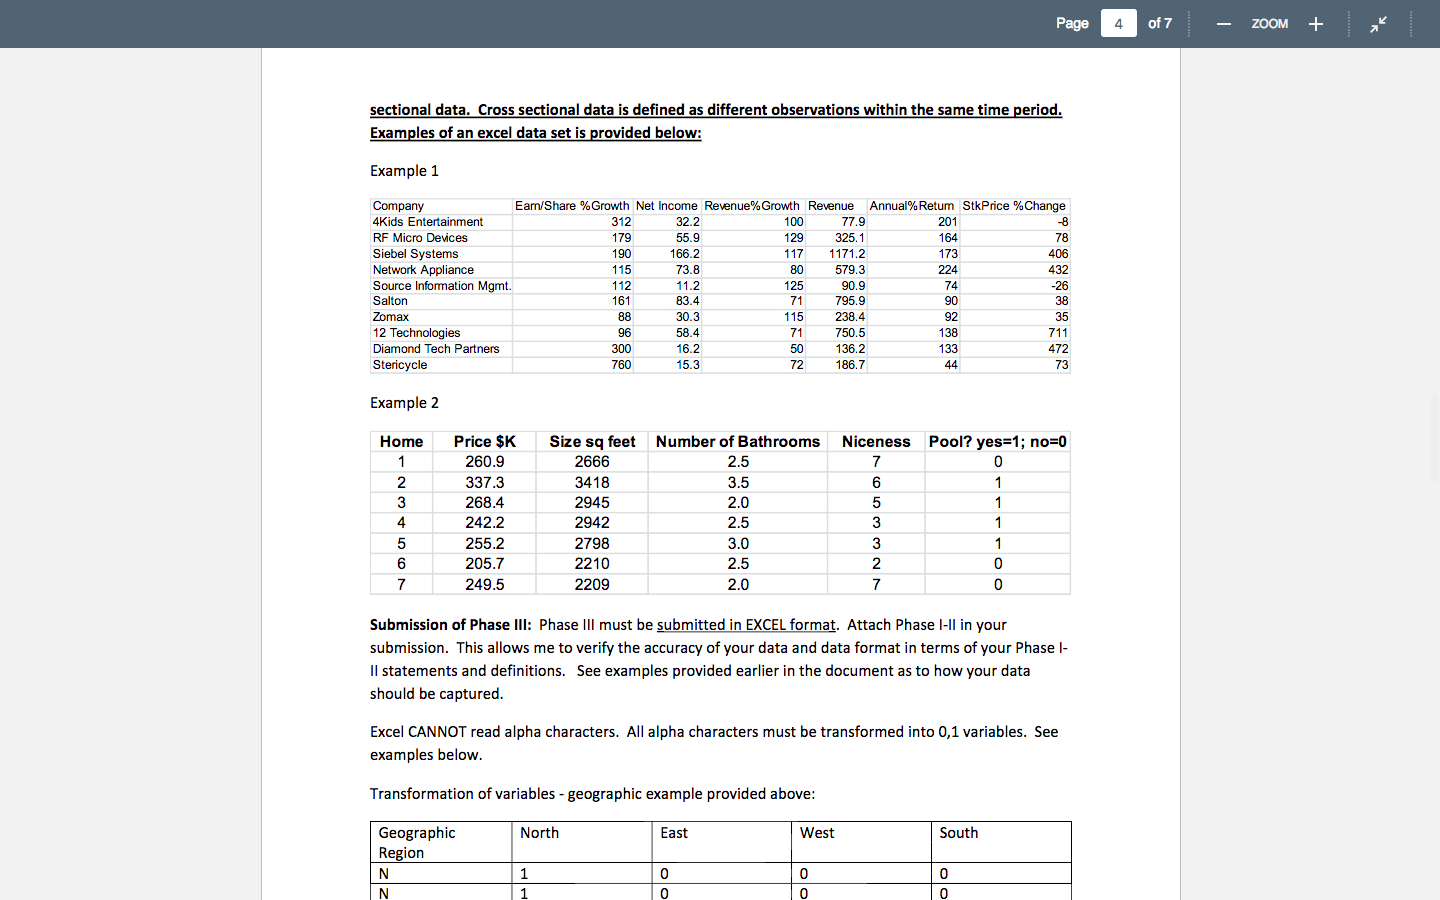
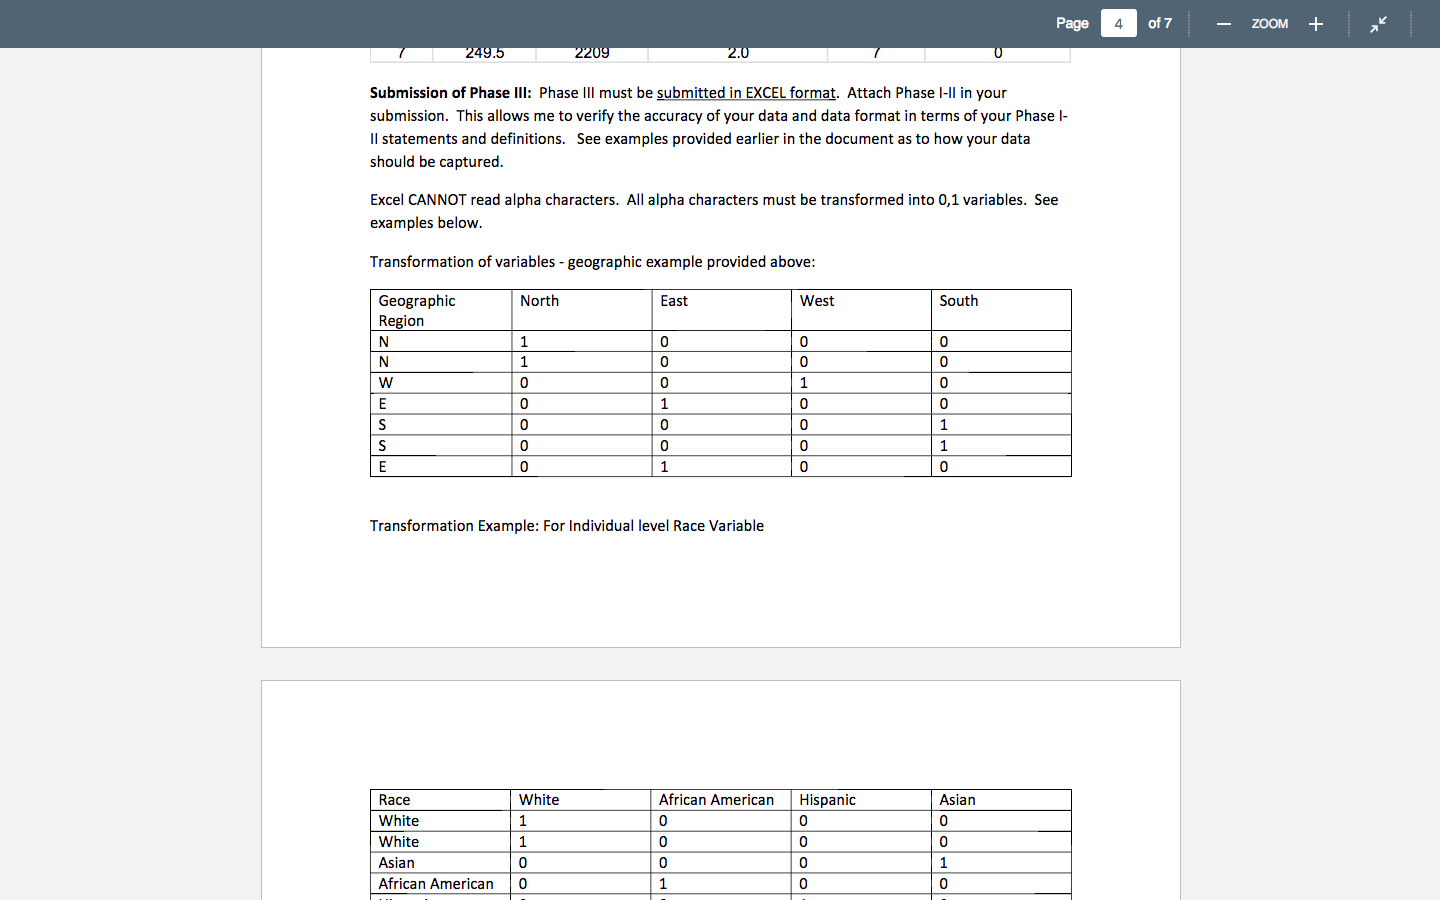
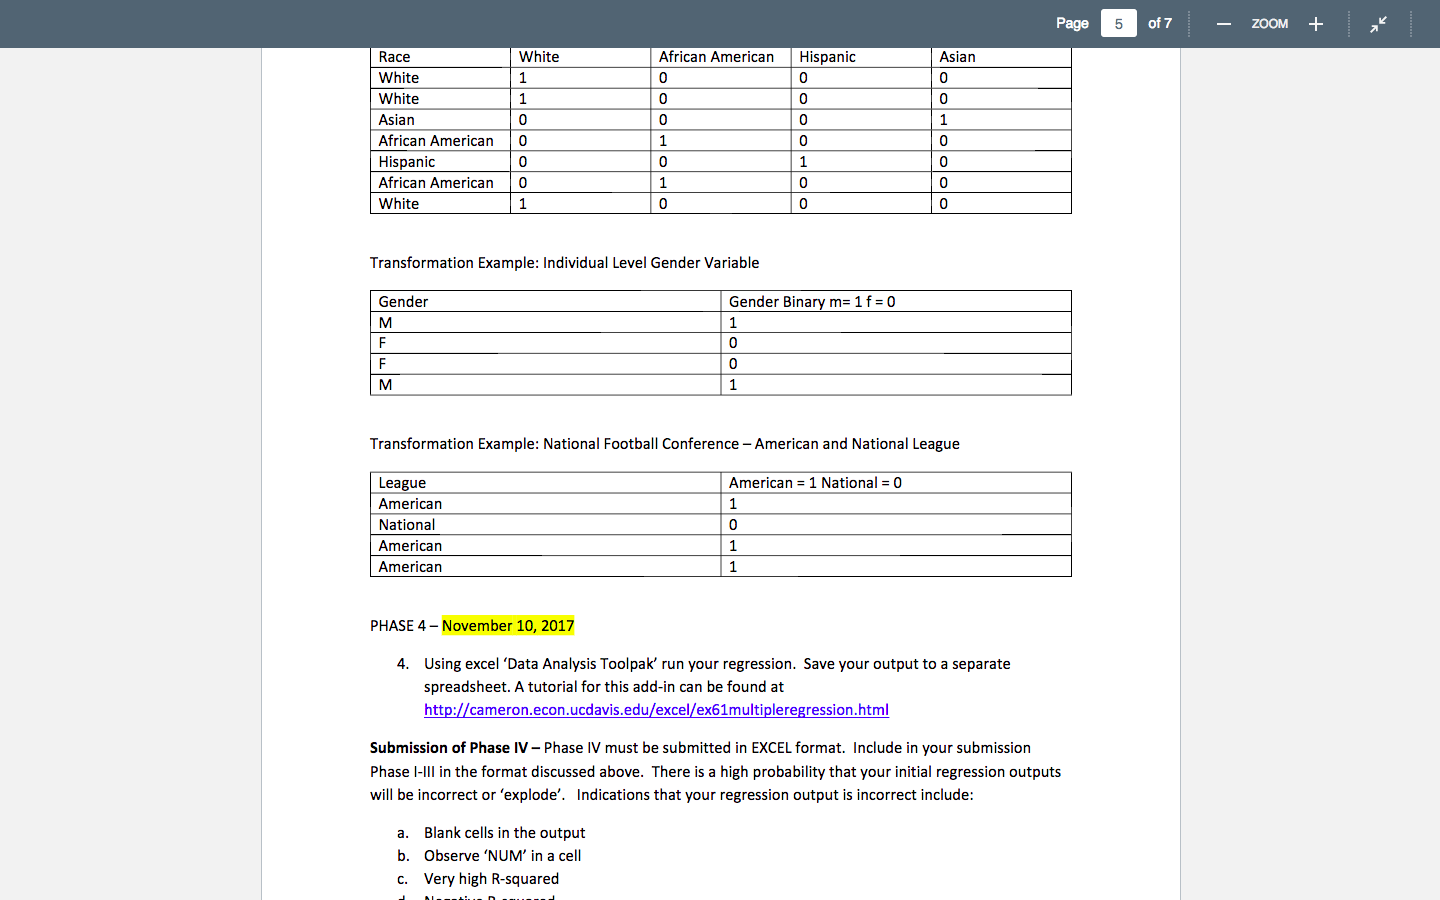
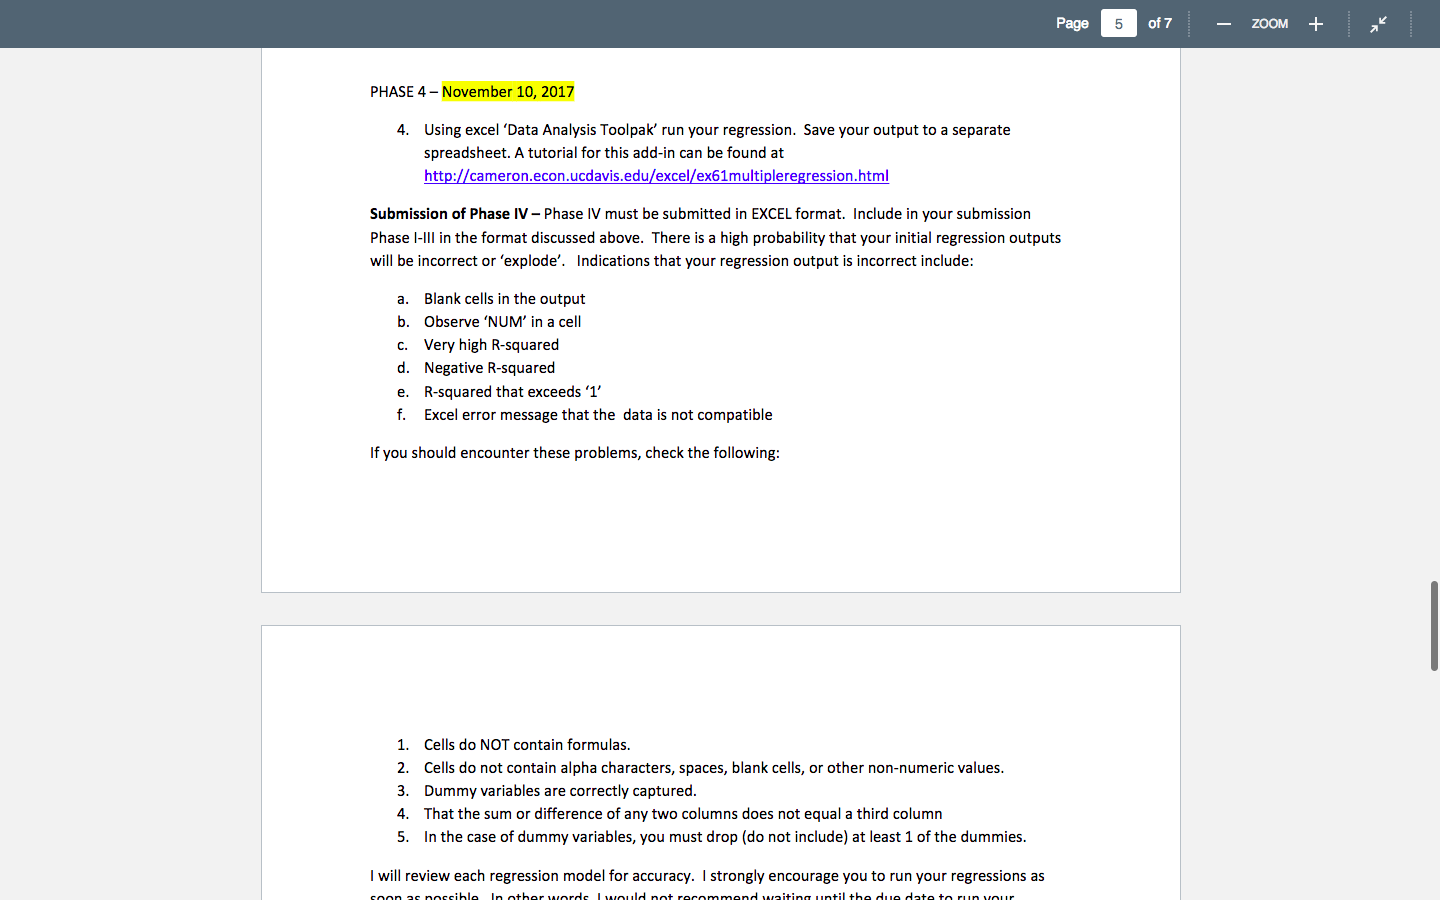
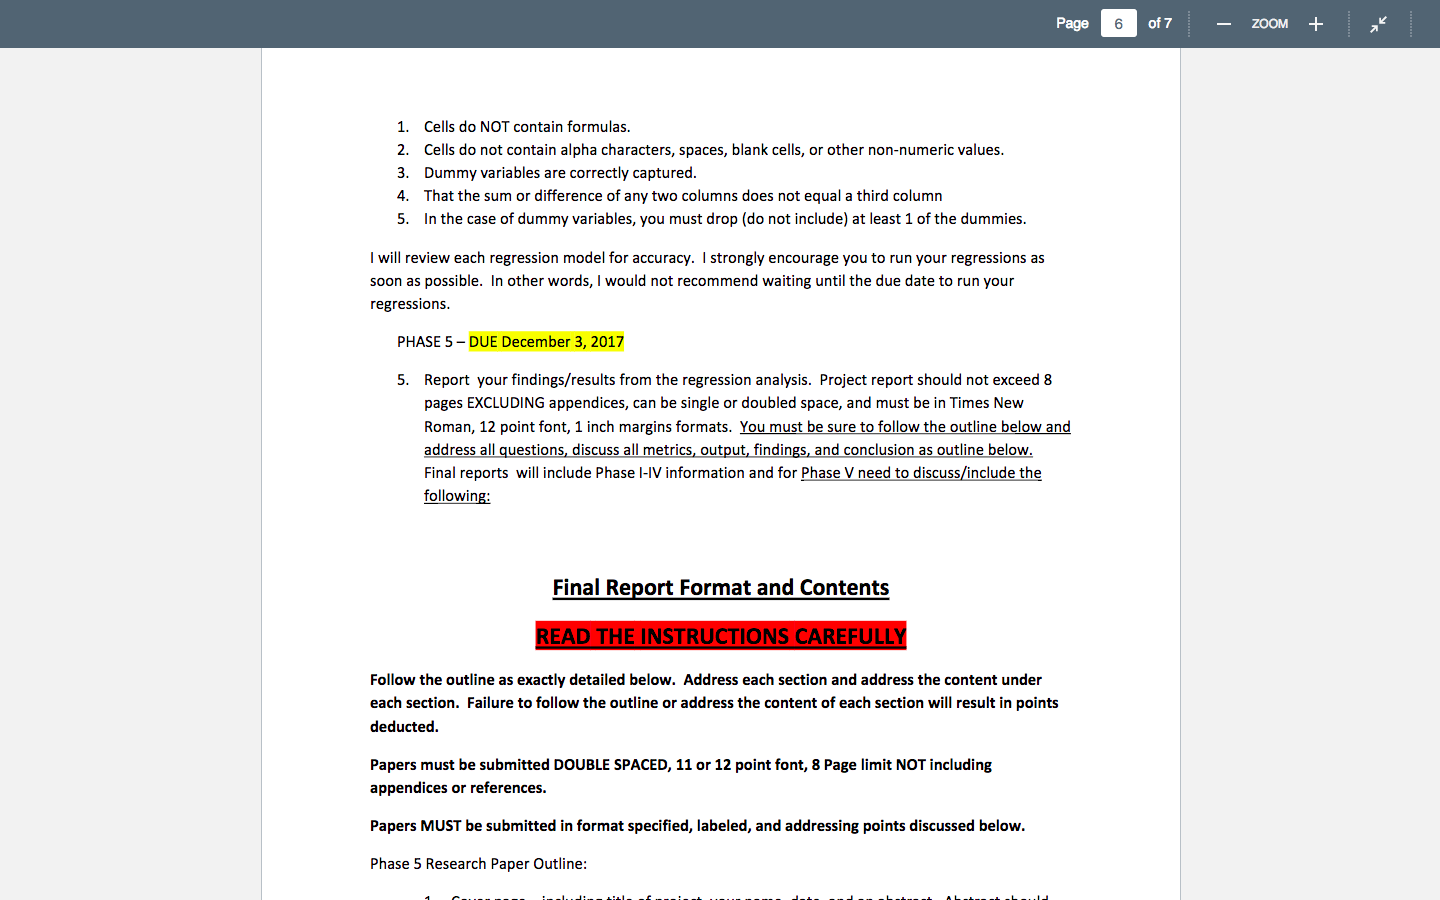
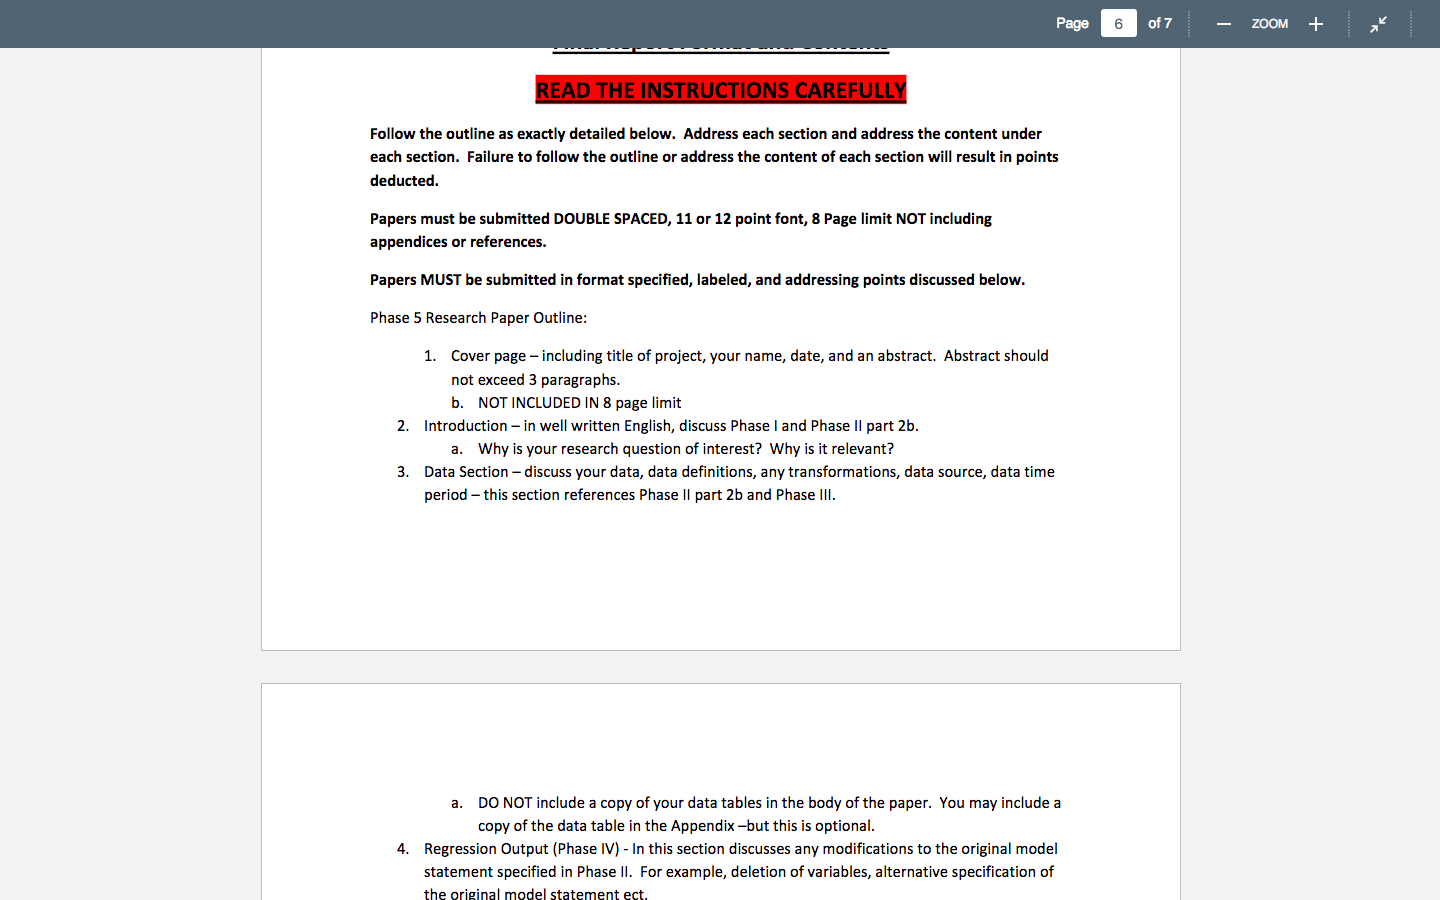
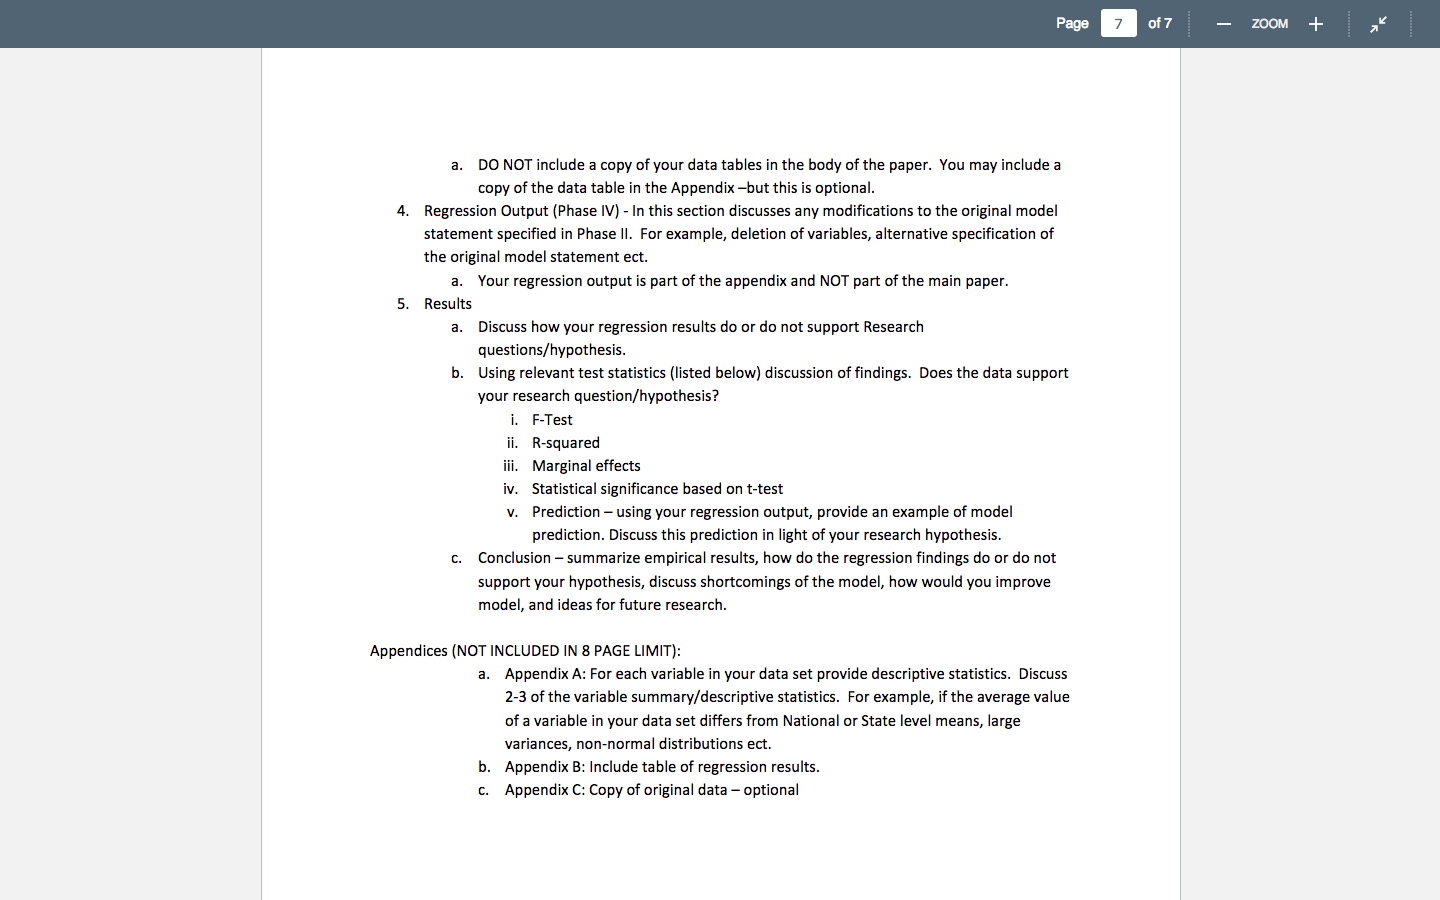
of 7 ZOOM + Statistical Research Projects Project Objective: Application ofstatistical concepts and techniques taught in QM 292. Project Outcomes: Formulation of research hypothesis and relevant model specication, data set construction, and empirical analysis of model results. Students can work as individuals or in teams of two. The project consists of 5 phases with each phase due to the instructor by midnight ofthe prescribed due date. Each completed Phase must be submitted to me electronically ttfblackstoneunaedu] by the due date. The project is worth IOU points and constitutes 1096 of your total grade for this course. Failure to submit a completed phase bythe due date will result in a penalty of one letter grade or 10 points from the total pro'ect grade. Note of caution, if you chose to work in a team and your team member fails to submit an individual phase by the due date or submit the project in its entirety by the due date' both team members will be assessed penalty points. If your team member withdraws from the course you alone will be responsible 'lor the gro'ect which includes meeting all reguired deadline submissions. Graduating seniors who fail to submit the final project as an individual or as part of a team will receive an 'I' lincom plate for the courseL. The project is due December 3. 2017 in electronic format. Email completed reports to tfblackstoneunaedu. PHASE 1 - September 3 2017 3. Identify and state a research question of interest. The research question must be stated such that multiple linear regression can be applied to the analysis of the question. In Phase 1 address {a} why is your research question of interest to the reader and lb) Why is your research question relevant? Examples of questions where multiple linear regression is not applicable: a. Is there any difference in BMI between males and females? This is test of means. b. Does Google stock have greater performance variability as compared to Yahoo? This is a variance test. Examples of research questions might be: c. Females or more likely to attrite from college then males. Alternatively, this can be phrased as 'Is there any difference in the college attrition rate between the genders'? of? Is the consumer price index a good predictor of Christmas retail spending? Was President Obama's American Recovery and Reinvestment Act successful in stimulating the US economy after the May 2007 housing crash? What factors a re most likely to influence stock performance? Does parental income and education influence BMI? To what extent is defense spending inuenced by world oil prices and US oil demand? What 'lactors (demographic, macroeconomic, industrial spending, environmental) are most likely to predict the outbreak of Ebola or other diseases (polio, malaria, bird flu)? FEET" PHASE 2 September 22l 2017 2. In a general 'lormat, state the model. In other words, identify your dependent and independent variables. Your model must include at least 3 independent variables. but not to exceed 7 indannndnnv uni-i: hlnu ZOOM + of 7 ZOOM + 2. In a general 'lormat, state the model. In other words, identify your dependent and independent variables. Your model must include at least 3 independent variables, but not to exceed 7 independent variables. 3. EXAMPLE: if your research question is: \" Does parental income and education influence EMI? ", then the dependent variable would be BMI and the independent variables would be parental edumtion and parental income. i. The general modelstatement: BMI =flparental education, parental income]. 2b. Identify the source or sources ofyour data. When using cross-sectional data ALL data must be pulled from the same time period but can be pulled from different sources. Identify the source and time period for each data element. 2c. Data sets much have a minimum of 50 observations, but not to exceed 100 observations. 2d. Include a denition of each data element, data source, and period for which data element is captured. For example: BMI = Body Mass Index, is measure by body mass divided bythe square of the individual's height. Data source: Health and Human Services, www.hhs.gov scal year 2010, state level data. Example #2: Parental income : is combined household annual income. Data Source: www.bls.gov state level data for 2El12. IMPORTANT: Your dependent variable cannot be binary, categoricalj'ranking, or strictly a discrete variable. Your dependent variable must be a continuous variable. Your independent variables an be all continuous or a mix of discrete and continuous. Your independent variables CANNOT be strictly discrete variables. Submission of Phase I II: Must be submitted in WORD format. The word document should be attached to your email. Do not send Phase I and II as part ofthe body of an email. As part of the Phase II submission include Phase i. Definition of variables (see Phase II '2b'] should include time period data is captured, explicit definition of variable measurement or how the variable will be transformed for inclusion in Phase IV. For example: INCORRECT: Weight-' how much a person weighs.' of 7 ZOOM + CORRECT: Weight 'weig ht as measured in pounds', data source Center for Disease Control, www.cdc.gov individual level data, 2010. INCORRECT: Unemployment rate 'the unemployment rate' CORRECT: Unemployment rate 'the number of people unemployed per 1000, data source Bureau of Labor Statistiu, www.bls.gov state level data 2011. Transformed Variables (see Phase 3 for example]: Categorical variables such as gender, raoe, color, manufacturing sector, team, geographic region, as examples, need to be transformed into quantitative variables. For example, gender is captured as M or F, this will need to be transformed into 0.1 variable. Example: M = 0 and F = 1 or M :1 and F = 0. The definition should read ifM then M = 0 and ifF then F=1 Example: Let's assume your data contains 4 geographic regions, North, South, East, and West then for Phase il you will need to define the states that comprise the North geographic region, similarly for east, west, and south. in Phase III, you will need to transform these variables into columns of 0,1 dummy variables. See examples below. PHASE 3 - October 20 2017 3. Analysis of your research question requires data. There are three general sources of data; (1) survey, (2} historical data, and (3} experimental data. a. Survey data is response data from questionnaires. Students can construct a survey and collect their own data for purposes ofthis project In] PERMISSION OF THE INSTRUCTOR ONLY. Students wishing to use survey data must provide me a copy of the survey prior to data collection for review. There are issues of privacy and human subiects protection that must be considered with every survey. b. Historical data - is largely collected by public and private institutions. There are numerous publically available data sources on the web: i. htt : www.rfe.or showCat. h ?cat id:2 ii. http:{www.bls.govdata{ iii. httgwwwfreenancialdatacomjstocksfindex-datai to data oollection for review. There are issues of privacy and human subjects protection that must be considered with every survey. b. Historical data - is largely collected by public and private institutions. There are numerous publically available data sources on the web: 1. ii. iii. iv. V. v1. Vll. htt : www.rfe.or showCat. h ?cat id=2 http:[,fwww.bls.gov,fdata[ httgwwwfreenancialdata.oom/stocks/indexdatal httpu!(WWW.census.govcompendiaistatabi htt : www.healthdata. ov htt : nces.ed. ov www.clggd ata.com c. Experimental data data obtained from controlled experiments. Using experimental data is not recommended for the purposes of this project. Identify your data souroets). Once the data sourcels) haslhave been identied, '1an the data into an excel spreadsheet. Your data set must contain minimum of 50 observations. All data must be crass sectional data. Cross sectional data is dened as different observations within the same time period. Examples of an excel data set is provided below: Example 1 Company 4Kid5 Entertainment RF Mime Denes Slebel Systems Network Appl lance Source Inhrmatlon Mgmt. Salton Earrvshare'llasmh Nellncnme Rmenuettercmth Revenue Amusmelum StkPrine %Change 312 32.2 mm 77.9 201 8 179 55.9 129 325.1 164 7'8 190 166.2 117 1171.2 173 me 115 73.6 50 579.3 224 432 112 11.2 125 90.9 74 726 161 83.4 71 795.9 90 38 Page a of? sectional data. Cross sectional data is dened as different observations within the same time period. Examples of an excel data set is provided below: Example 1 Company 4Kids Entertainment RF Minna Della Siehei Systems Network Appliance Source Information Mgmt. Salton anax 12 Technologies Diamond Tenn Partners Srecycle Example 2 Home Price SK 1 260.9 2 337.3 3 263.4 4 242.2 5 255.2 6 205.? 7 249.5 5129 sq feet 2666 3413 2945 2942 2793 2210 2209 312 179 190 115 112 161 68 96 300 760 32.2 101: 55.9 129 166.2 117 1 73.6 an 11.2 125 33.4 71 30.3 115 53.4 71 15.: so 15.3 72 NumberofBathrooms 2.5 3.5 2.0 2.5 3.0 2.5 2.0 77.9 325.1 171.2 579.3 90.9 795.9 233.4 750.5 136.2 186.7 Niceness 7 Hummus: Earni'Share 51:6th Nellhcume Fhuanue'asmwth Revenue Annual%Relum Sth'rine \"Change 201 -8 164 7'8 173 me 224 432 3'4 726 90 38 92 35 133 711 133 472 M 73 Pool? yes=1j no=0 {J coiid Submission of Phase III: Phase I\" must be submitted in EXCEL format. Attach Phase MI in your submission. This allows me to verify the accuracy of your data and data format in terms of your Phase |- || statements and denitions. See examples provided earlier in the document as to how your data should be captured. Excel CANNOT read alpha characters. All alpha characters must be transformed into 0.1 variables. See exam ples below. Transformation ofvariables - geographic example provided above: Geographic North East West South Region N l U 0 U N 1 CI 0 0 ZOOM + Submission of Phase III: Phase I\" must be submitted in EXCEL format. Attach Phase MI in your submission. This allows me to verify the accuracy of your data and data format in terms of your Phase |- || statements and denitions. See examples provided earlier in the document as to how your data should be captured. Excel CANNOT read alpha characters. All alpha characters must be transformed into 0.1 variables. See exam ples below. Transformation ofvariables - geographic example provided above: Geographic Region N N W E S S E Transformation Example: For Individual level Race Variable Race White African American Hispanic El Africa n American [I [I [I African American Africa n American Hispanic Africa n American White Gender Gender Binary m:1f:0 M 1 F Cl F Cl M 1 Transformation Example: National Football Conference American and National League American : 1 National: 0 American National American American I->-o PHASE 4- November 10, 201? 4. Using excel 'Data Analysis Toolpak' run your regression. Save your output to a separate spreadsheet. A tutorial for this add-in can be found at httgcameronecun.ucdayisedufexcelfexlmultipleregression.html Submission of Phase IV- Phase IV must be submitted in EXCELformat. Include in your submission Phase H" in the format discussed above. There is a high probability that your initial regression outputs will be incorrect or 'explode'. Indications that your regression output is incorrect include: Blank cells in the output Observe 'NUM' in a cell Very high Rvsquared Lop"? uf 7 ZOOM + PHASE 4- November 10, 2017 4. Using excel 'Data Analysis Toolpak' run your regression. Save your output to a separate spreadsheet. A tutorial for this add-in can be found at httgcameronecon.ucdavis.edufexcelfex6lmultipleregression.htm| Submission of Phase IV- Phase IV must be submitted in EXCELformat. Include in your submission Phase H" in the format discussed above. There is a high probability that your initial regression outputs will be incorrect or 'explode'. Indications that your regression output is incorrect include: Blank cells in the output Observe 'NUM' in a cell Very high Rvsquared Negative R-squared R-squared that exceeds '1' Excel error message that the data is not compatible Franny"? If you should encounter these problems, check the following: Cells do NOT contain formulas. Cells do not contain alpha characters, spaces, blank cells, or other non-numeric values. Dummy variables are correctly captured. That the sum or difference of any two columns does not equal a third column .V'PPNP In the case of dummyvariables. you must drop {do not include) at least 1 of the dummies. I will review each regression model for accuracy. I strongly encourage you to run your regressions as l-nnn an nuanihln In nth-m- \"mu-dc I umuld mn- mamand Inuil'inn until Hm dun darn fn mn unri! Cells do NOT contain formulas. Cells do not contain alpha characters, spaces, blank cells, or other nonvnumeric values. Dummy variables are correctly captured. That the sum or difference of any two columns does not equal a third column .V'PPPP In the case of dummyyariahles. you must drop {do not include) at least 1 of the dummies. I will review each regression model for accuracy. I strongly encourage you to run your regressions as soon as possible. In other words, I would not recommend waiting until the due date to run your regressions. PHASE 5 - DUE December 3, 2017 5. Report your findingslresults from the regression analysis. Project report should not exceed 8 pages EXCLUDING appendices, can be single or doubled space, and must be in Times New Roman, 12 point font, 1 inch margins formats. You must be sure to follow the outline below and address all guestionsI discuss all metriu output findings and conclusion as outline below. Final reports will include Phase l-IV information and for Phase V need to discussZinclude the following: Final Report Format and Contents Follow the outline as exactly detailed below. Address each section and address the content under each section. Failure to follow the outline or addressthe content afeach section will result in points deducted. Papers must he submitted DOUBLE SPACED. 11 or 12 point font. 3 Page limit NOT including appendices or references. Papers MUST be submitted in format specied, labeled. and addrsing poinh discussed below. Phase 5 Research Paper Outline: 4 ,_________ :__n..u-.__.:.u_ _: ___!__.. .._.._____ J _____ 4-- _|__.___. n...___. _|__..u Page a of? Follow the outline as exactly detailed below. Address each section and address the content under each section. Failure to follow the outline or address the content of each section will result in points deducted. Papers must he submitted DOUBLE SPACED, 11 or 12 point font. 3 Page limit NOT including appendica or references. Papers MUST be submitted in format specied, labeled. and addrasing poinu discussed below. Phase 5 Research Paper Outline: 1. Cover page including title of project, your name, date, and an abstract. Abstract should not exceed 3 pa ragra phs. b. NOTINCLUDED IN 3 page limit 2. Introduction - in well written English, discuss Phase I and Phase II part 2b. 3. Why is your research question of interest? Why is it relevant? 3. Data Section - discuss your data, data denitions, any transformations, data source, data time period - this section references Phase ll part It: and Phase Ill. a. DO NOT include a copy of your data tables in the body of the paper. You may include a copy ofthe data table in the Appendix but this is optional. 4. Regression Output (Phase IV) In this section discusses any modifications to the original model statement specied in Phase II. For example, deletion of variables, alternative specifimtion of the orieinal model statement ect. ZOOM + of 7 ZOOM + a. DO NOT include a copy of your data tables in the body of the paper. You may include a copy ofthe data table in the Appendix but this is optional. 4. Regression Output (Phase IV) In this section discusses any modifications to the original model statement specied in Phase II. For example, deletion of variables, alternative specification of the original model statement ect. 3. Your regression output is part of the appendix and NOT part of the main paper. 5. Results 3. Discuss how your regression results do or do not support Research questionsfhypothesis. b. Using relevant test statistics {listed below) discussion of findings. Does the data support your research questionlhypothesis? 'I. F-Test ii. R-squared iii. Marginal effects iv. Statistical signicance based on t-test v. Prediction using your regression output, provide an example of model prediction. Discuss this prediction in light of your research hypothesis. c. Conclusion summarize empirical results, how do the regression ndings do or do not support your hypothesis, discuss shortcomings ofthe model, how would you improve model, and ideas for future research. Appendices (NOT INCLUDED IN 3 PAGE LIMIT): a. Appendix A: For each variable in your data set provide descriptive statistics. Discuss 2-3 o'fthe variable summaryfdescriptive statistics. For example, if the average value of a variable in your data set differs from National or State level means, large variances, non-normal distributions ect. b. Appendix B: Include table of regression results. c. Appendix C: Copy of original data - optional
