Answered step by step
Verified Expert Solution
Question
1 Approved Answer
In Dr. Ken Campbell's laboratory (a retired professor in Bioengineering at WSU), they used a volume measurement device for an isolated mouse heart. Here

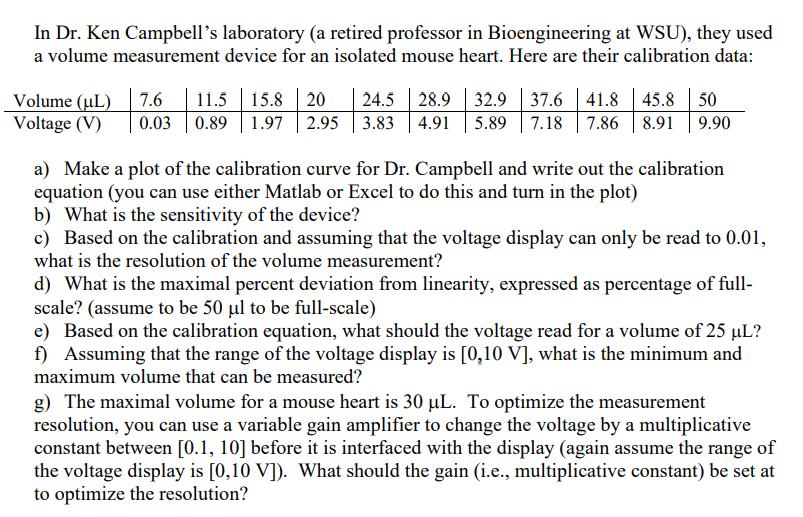
In Dr. Ken Campbell's laboratory (a retired professor in Bioengineering at WSU), they used a volume measurement device for an isolated mouse heart. Here are their calibration data: Volume (UL) 7.6 11.5 15.8 20 24.5 28.9 32.9 37.6 41.8 45.8 50 Voltage (V) 0.03 0.89 1.97 2.95 3.83 4.91 5.89 7.18 7.86 8.91 9.90 a) Make a plot of the calibration curve for Dr. Campbell and write out the calibration equation (you can use either Matlab or Excel to do this and turn in the plot) b) What is the sensitivity of the device? c) Based on the calibration and assuming that the voltage display can only be read to 0.01, what is the resolution of the volume measurement? d) What is the maximal percent deviation from linearity, expressed as percentage of full- scale? (assume to be 50 ul to be full-scale) e) Based on the calibration equation, what should the voltage read for a volume of 25 L? f) Assuming that the range of the voltage display is [0,10 V], what is the minimum and maximum volume that can be measured? g) The maximal volume for a mouse heart is 30 L. To optimize the measurement resolution, you can use a variable gain amplifier to change the voltage by a multiplicative constant between [0.1, 10] before it is interfaced with the display (again assume the range of the voltage display is [0,10 V]). What should the gain (i.e., multiplicative constant) be set at to optimize the resolution?
Step by Step Solution
There are 3 Steps involved in it
Step: 1
a Plot of the calibration curve and calibration equation The calibration curve is a plot of the voltage V versus the volume L of the isolated mouse heartThe calibration equation is the mathematical re...
Get Instant Access to Expert-Tailored Solutions
See step-by-step solutions with expert insights and AI powered tools for academic success
Step: 2

Step: 3

Ace Your Homework with AI
Get the answers you need in no time with our AI-driven, step-by-step assistance
Get Started


