Question
In epidemiology, the SIR model is used to predict the spread of a disease. A simple SIR model was created by Kermack and McKendrick in
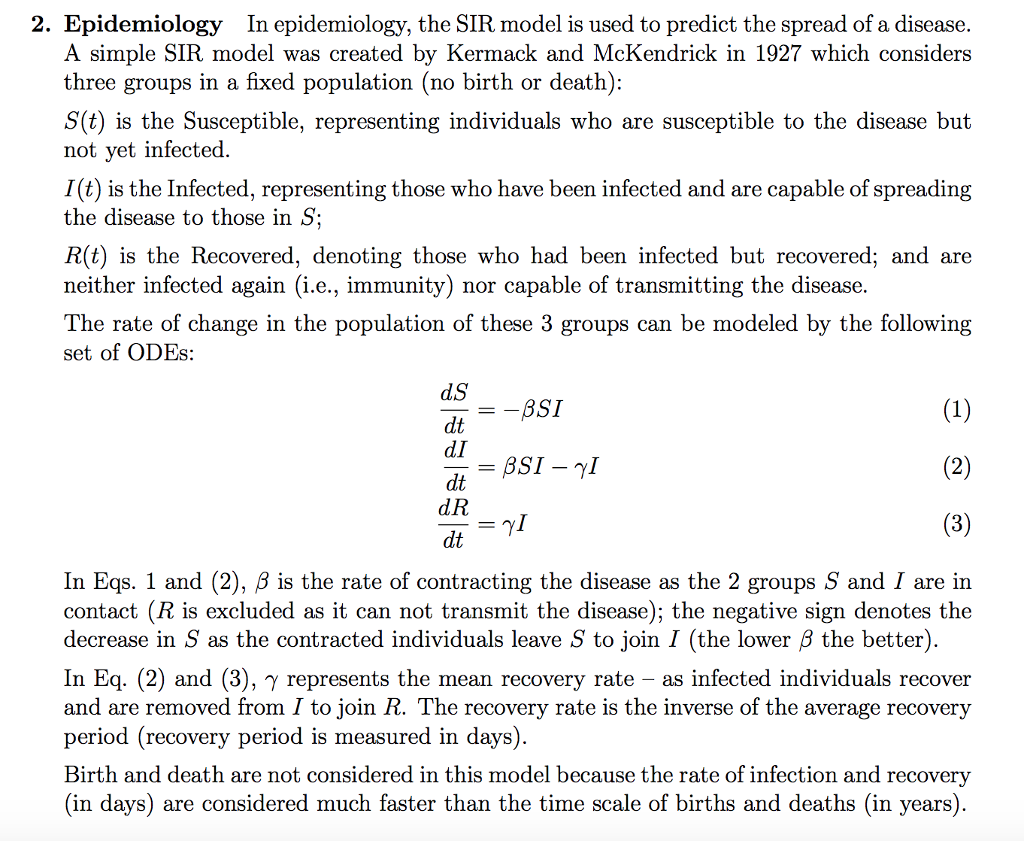
In epidemiology, the SIR model is used to predict the spread of a disease. A simple SIR model was created by Kermack and McKendrick in 1927 which considers three groups in a fixed population (no birth or death): S(t) is the Susceptible, representing individuals who are susceptible to the disease but not yet infected. I(t) is the Infected, representing those who have been infected and are capable of spreading the disease to those in S; R(t) is the Recovered, denoting those who had been infected but recovered; and are neither infected again (i.e., immunity) nor capable of transmitting the disease.
The rate of change in the population of these 3 groups can be modeled by the following set of ODEs:
dS dt = ??SI (1)
dI dt = ?SI ? ?I (2)
dR dt = ?I (3)
In Eqs. 1 and (2), ? is the rate of contracting the disease as the 2 groups S and I are in contact (R is excluded as it can not transmit the disease); the negative sign denotes the decrease in S as the contracted individuals leave S to join I (the lower ? the better). In Eq. (2) and (3), ? represents the mean recovery rate as infected individuals recover and are removed from I to join R. The recovery rate is the inverse of the average recovery period (recovery period is measured in days). Birth and death are not considered in this model because the rate of infection and recovery (in days) are considered much faster than the time scale of births and deaths (in years).
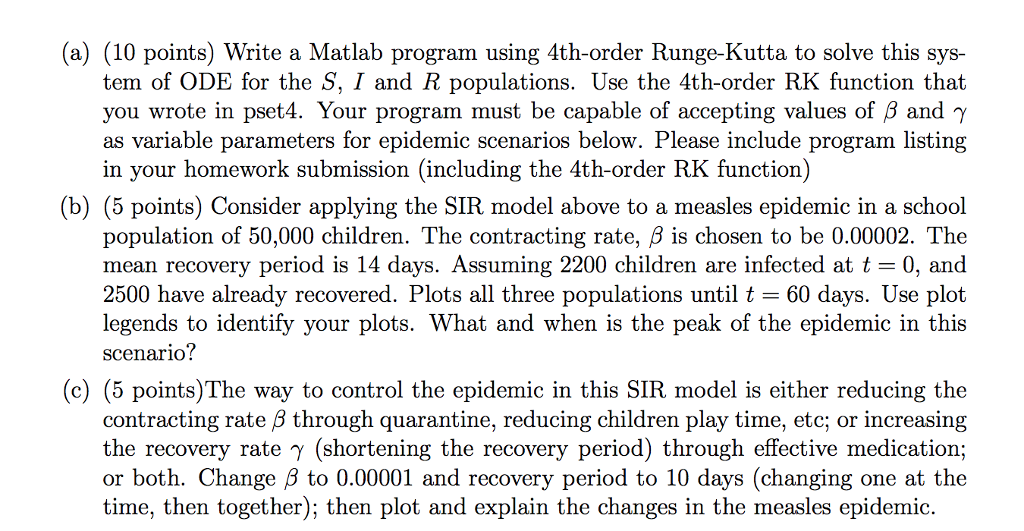
(a) (10 points) Write a Matlab program using 4th-order Runge-Kutta to solve this system of ODE for the S, I and R populations. Use the 4th-order RK function that you wrote in pset4. Your program must be capable of accepting values of ? and ? as variable parameters for epidemic scenarios below. Please include program listing in your homework submission (including the 4th-order RK function)
(b) (5 points) Consider applying the SIR model above to a measles epidemic in a school population of 50,000 children. The contracting rate, ? is chosen to be 0.00002. The mean recovery period is 14 days. Assuming 2200 children are infected at t = 0, and 2500 have already recovered. Plots all three populations until t = 60 days. Use plot legends to identify your plots. What and when is the peak of the epidemic in this scenario?
(c) (5 points)The way to control the epidemic in this SIR model is either reducing the contracting rate ? through quarantine, reducing children play time, etc; or increasing the recovery rate ? (shortening the recovery period) through effective medication; or both. Change ? to 0.00001 and recovery period to 10 days (changing one at the time, then together); then plot and explain the changes in the measles epidemic.
Step by Step Solution
There are 3 Steps involved in it
Step: 1

Get Instant Access to Expert-Tailored Solutions
See step-by-step solutions with expert insights and AI powered tools for academic success
Step: 2

Step: 3
Ace Your Homework with AI
Get the answers you need in no time with our AI-driven, step-by-step assistance
Get Started