Answered step by step
Verified Expert Solution
Question
1 Approved Answer
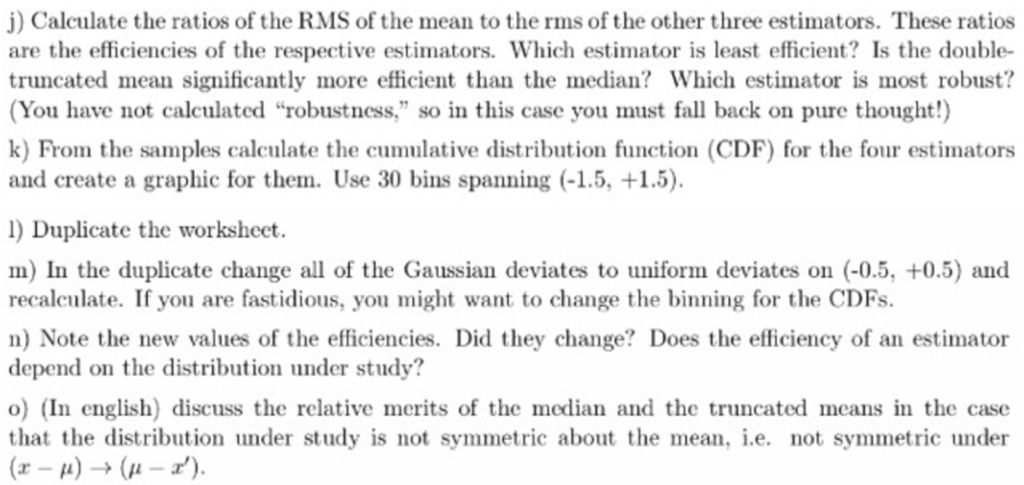
In Excel, can someone help me with PART G ONWARDS Here's my file: https://docs.google.com/spreadsheets/d/1Bt9ccQVdcENZLq17iHEcWypKJMMI7JWJkl6dSjJzu8U/edit?usp=sharing g) For each of the four estimators compute the mean of
In Excel, can someone help me with PART G ONWARDS
Here's my file:https://docs.google.com/spreadsheets/d/1Bt9ccQVdcENZLq17iHEcWypKJMMI7JWJkl6dSjJzu8U/edit?usp=sharing


Step by Step Solution
There are 3 Steps involved in it
Step: 1

Get Instant Access to Expert-Tailored Solutions
See step-by-step solutions with expert insights and AI powered tools for academic success
Step: 2

Step: 3

Ace Your Homework with AI
Get the answers you need in no time with our AI-driven, step-by-step assistance
Get Started


