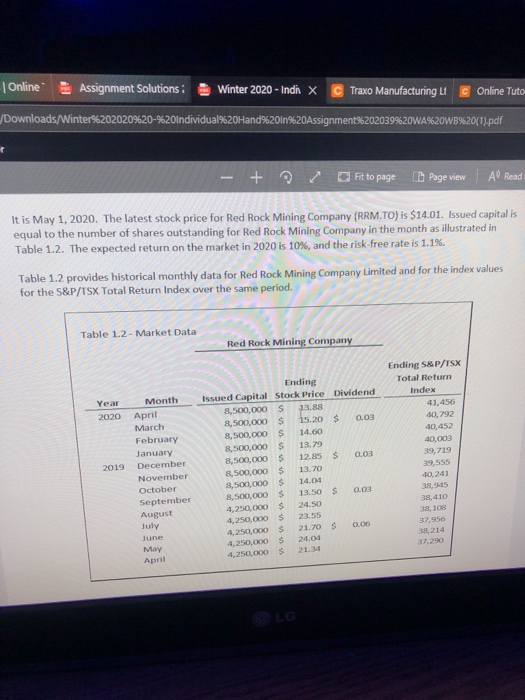
In Excel, plot a properly labeled Characteristic line for Red Rock Mining.
Online Assignment Solutions Winter 2020 - Indix Traxo Manufacturing LI c Online Tuto Downloads/Winter%202020%20-%20Individual%20Hand%20in%20Assignment%202039%20WA%20WB%20(1).pdf - + Fit to page Page View A Read It is May 1, 2020. The latest stock price for Red Rock Mining Company (RRM.TO) is $14.01. Issued capital is equal to the number of shares outstanding for Red Rock Mining Company in the month as illustrated in Table 1.2. The expected return on the market in 2020 is 10%, and the risk-free rate is 1.1%. Table 1.2 provides historical monthly data for Red Rock Mining Company Limited and for the index values for the S&P/TSX Total Return Index over the same period. Table 1.2 - Market Data Red Rock Mining Company Ending S&P/TSX Total Return Index Year 2020 2019 Month April March February January December November October September August July June May April Ending issued Capital Stock Price Dividend 8,500,000 $ 13.88 8,500,000 $ 15.20 $ 0.03 8,500,000 $ 14.60 8,500,000 $ 13.79 8,500,000 $ 12.85 $ 8,500,000 $ 13.70 8,500,000 $ 14.04 8,500,000 $ 13.50 $ 0.03 4,250,000 $ 24.50 4,250,000 $ 23.55 4,250,000 $ 21.70 S 0.06 4,250,000 $ 24.04 4,250,000 $ 21.34 41,456 40,792 40,452 40,003 39,719 39,555 40.241 38,95 38,410 38, 108 37,956 3,214 37,290 Online Assignment Solutions Winter 2020 - Indix Traxo Manufacturing LI c Online Tuto Downloads/Winter%202020%20-%20Individual%20Hand%20in%20Assignment%202039%20WA%20WB%20(1).pdf - + Fit to page Page View A Read It is May 1, 2020. The latest stock price for Red Rock Mining Company (RRM.TO) is $14.01. Issued capital is equal to the number of shares outstanding for Red Rock Mining Company in the month as illustrated in Table 1.2. The expected return on the market in 2020 is 10%, and the risk-free rate is 1.1%. Table 1.2 provides historical monthly data for Red Rock Mining Company Limited and for the index values for the S&P/TSX Total Return Index over the same period. Table 1.2 - Market Data Red Rock Mining Company Ending S&P/TSX Total Return Index Year 2020 2019 Month April March February January December November October September August July June May April Ending issued Capital Stock Price Dividend 8,500,000 $ 13.88 8,500,000 $ 15.20 $ 0.03 8,500,000 $ 14.60 8,500,000 $ 13.79 8,500,000 $ 12.85 $ 8,500,000 $ 13.70 8,500,000 $ 14.04 8,500,000 $ 13.50 $ 0.03 4,250,000 $ 24.50 4,250,000 $ 23.55 4,250,000 $ 21.70 S 0.06 4,250,000 $ 24.04 4,250,000 $ 21.34 41,456 40,792 40,452 40,003 39,719 39,555 40.241 38,95 38,410 38, 108 37,956 3,214 37,290


