Question
In FastBatch Biotechnology Company vials with antibodies are produced in a in ANTIbodies FAST line. The fill target of each vial weight is 62.5 mg.
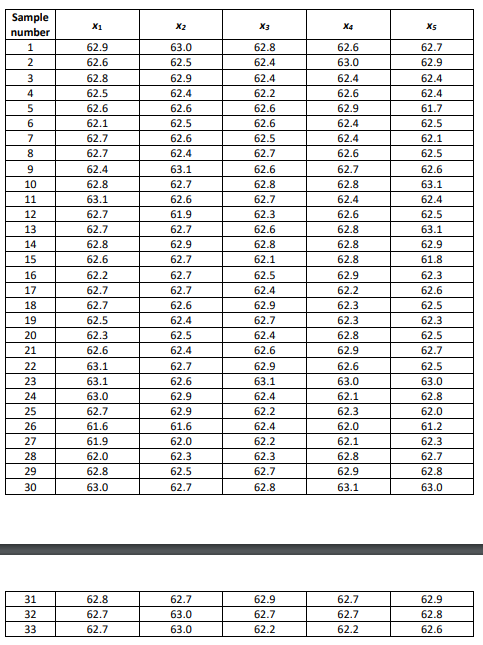
In FastBatch Biotechnology Company vials with antibodies are produced in a in ANTIbodies FAST line. The fill target of each vial weight is 62.5 mg. The Quality Control department determined an inspection of each of the filling lines to verify the weight in each of the manufacturing lines every 15 minutes. Five vials (n = 5) are collected every fifteen (15) minutes and weighed. The table below shows the results for 33 observations.
Every sample is discarded. Even though the sampling is required by regulators, it represents a significant amount of vials discarded. The Site Leader asked the ANTIbodies FAST to reconsider this situation and look for ways to reduce the amount of vials discarded.
Use Minitab to analyze the data and perform the following tasks:
1. Use the first twenty (20) observations to determine the LCL & UCL, for Xbar and R charts, using Minitab. Show control charts obtained. Show values of LCL & UCL.
2. Use the first twenty (20) observations to manually recalculate the LCL & UCL, for Xbar and R charts. Confirm your manual results with those obtained from Minitab. Hint: use an Excel spreadsheet.
3. Once you are satisfied with results in parts 1 & 2, plot the complete set of data provided (33 observations) in Xbar and R charts using the LCL & UCL obtained above. Generate a IM-R chart. What behaviors do you observe in the data? Determine if the process is stable and if it is in statistical control.
4. If necessary, revise your control limits, assume that any samples plotting outside control limits can be eliminated because are related to a new vial bottle that is bigger and replot Xbar and R control charts. Please note that only outliers that have an assignable cause can be removed from the data.

Step by Step Solution
There are 3 Steps involved in it
Step: 1

Get Instant Access to Expert-Tailored Solutions
See step-by-step solutions with expert insights and AI powered tools for academic success
Step: 2

Step: 3

Ace Your Homework with AI
Get the answers you need in no time with our AI-driven, step-by-step assistance
Get Started


