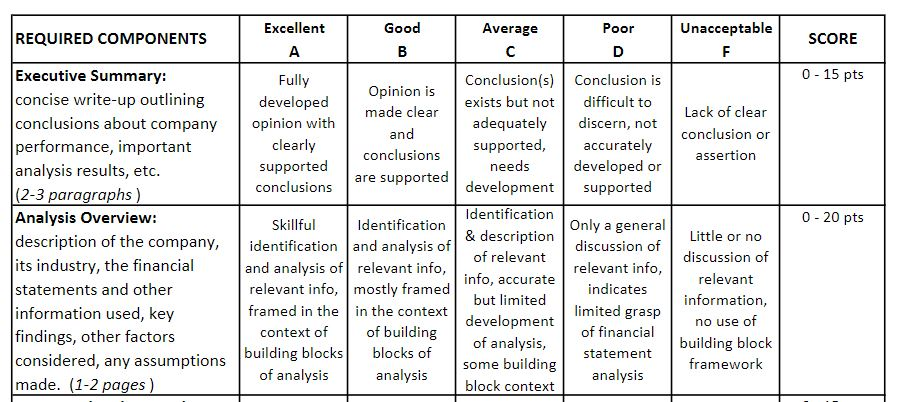
In Financial Statements Analysis Project Part 1, you are expected to compute a horizontal, vertical, and ratio analysis for one of the following companies using MS Excel. Please review the company you have picked, access its financial statements, and conduct the analysis.
INN Summit Hotel Properties FORM 10-K 2018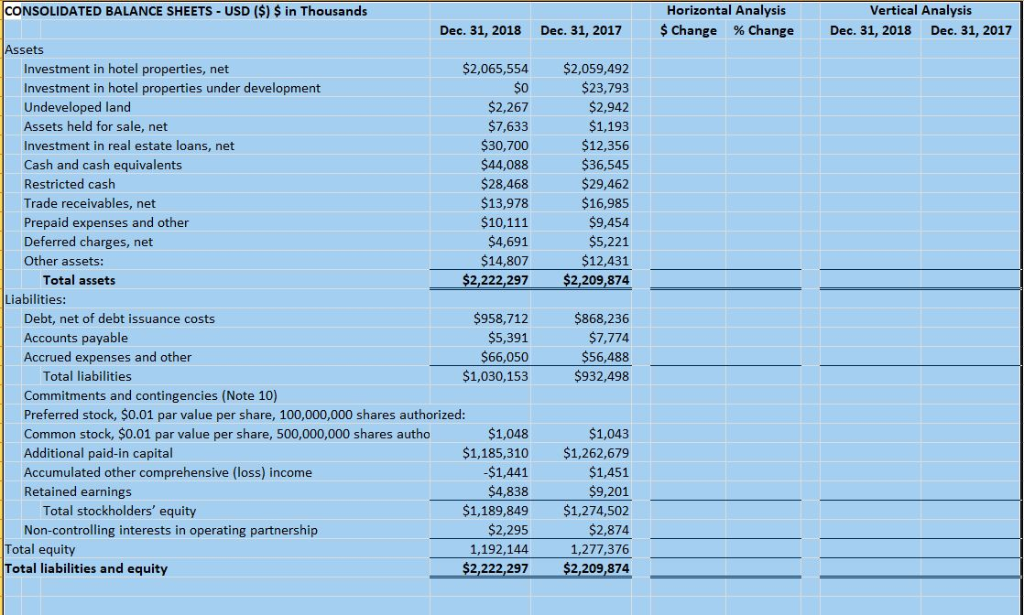
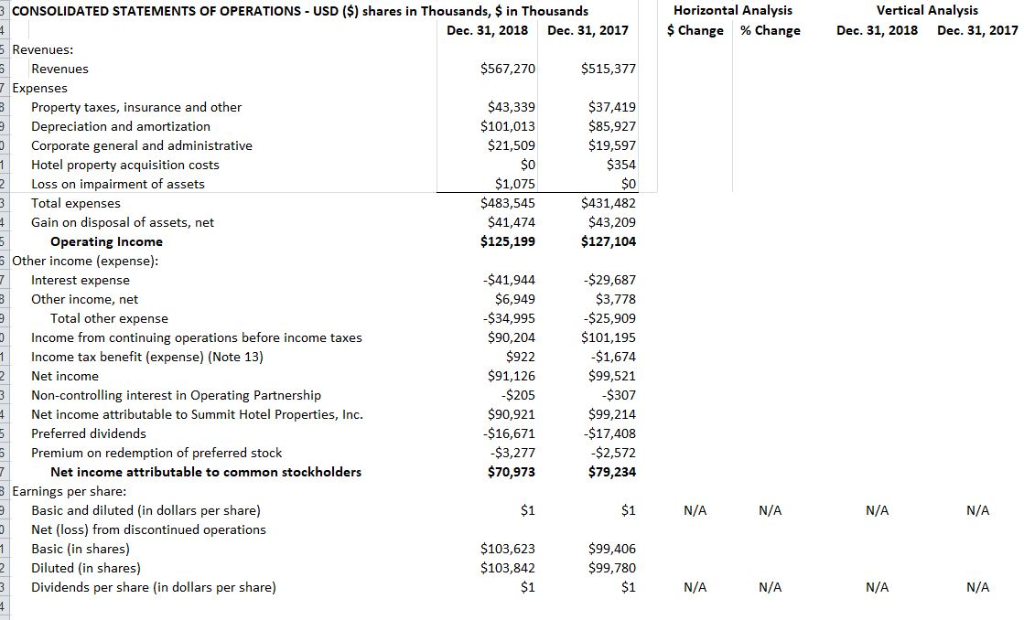
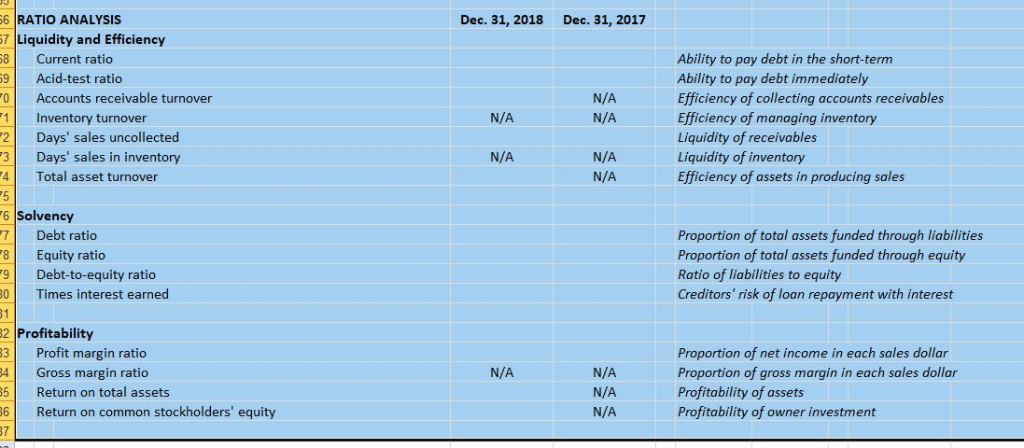
Dec. 31, 2017 Horizontal Analysis $ Change % Change Vertical Analysis Dec. 31, 2018 Dec 31, 2017 $0 $2,059,492 $23,793 $2,942 $1,193 $12,356 $36,545 $29,462 $16,985 $9,454 $5,221 $12,431 $2,209,874 CONSOLIDATED BALANCE SHEETS - USD ($) $ in Thousands Dec. 31, 2018 Assets Investment in hotel properties, net $2,065,554 Investment in hotel properties under development Undeveloped land $2,267 Assets held for sale, net $7,633 Investment in real estate loans, net $30,700 Cash and cash equivalents $44,088 Restricted cash $28,468 Trade receivables, net $13,978 Prepaid expenses and other $10,111 Deferred charges, net $4,691 Other assets: $14,807 Total assets $2,222,297 Liabilities: Debt, net of debt issuance costs $958,712 Accounts payable $5,391 Accrued expenses and other $66,050 Total liabilities $1,030,153 Commitments and contingencies (Note 10) Preferred stock, $0.01 par value per share, 100,000,000 shares authorized: Common stock, $0.01 par value per share, 500,000,000 shares autho $1,048 Additional paid-in capital $1,185,310 Accumulated other comprehensive (loss) income $1,441 Retained earnings $4,838 Total stockholders' equity $1,189,849 Non-controlling interests in operating partnership $2,295 Total equity 1,192,144 Total liabilities and equity $2,222,297 $868,236 $7,774 $56,488 $932,498 $1,043 $1,262,679 $1,451 $9,201 $1,274,502 $2,874 1,277,376 $2,209,874 Horizontal Analysis $ Change % Change Vertical Analysis Dec. 31, 2018 Dec. 31, 2017 2 3 CONSOLIDATED STATEMENTS OF OPERATIONS - USD ($) shares in Thousands, $ in Thousands Dec. 31, 2018 Dec. 31, 2017 5 Revenues: Revenues $567,270 $515,377 7 Expenses Property taxes, insurance and other $43,339 $37,419 Depreciation and amortization $101,013 $85,927 Corporate general and administrative $21,509 $19,597 Hotel property acquisition costs $354 Loss on impairment of assets $1,075 $0 3 Total expenses $483,545 $431,482 Gain on disposal of assets, net $41,474 $43,209 Operating Income $125,199 $127,104 S Other income (expense): Interest expense -$41,944 -$29,687 Other income, net $6,949 $3,778 Total other expense -$34,995 $25,909 Income from continuing operations before income taxes $90,204 $101,195 Income tax benefit (expense) (Note 13) $922 $1,674 Net income $91,126 $99,521 Non-controlling interest in Operating Partnership $205 $307 Net income attributable to Summit Hotel Properties, Inc. $90,921 $99,214 5 Preferred dividends -$16,671 -$17,408 Premium on redemption of preferred stock $3,277 -$2,572 Net income attributable to common stockholders $70,973 $79,234 Earnings per share: e Basic and diluted (in dollars per share) - $1 Net (loss) from discontinued operations Basic (in shares) $103,623 $99,406 Diluted in shares) $103,842 $99,780 Dividends per share (in dollars per share) $1 m 2 3 $1 N/A N/ A N / A N /A NA $99,780 3 N/A N/A N/A N/A Dec 31, 2018 Dec. 31, 2017 56 RATIO ANALYSIS 57 Liquidity and Efficiency Current ratio Acid-test ratio Accounts receivable turnover Inventory turnover Days' sales uncollected Days' sales in inventory Total asset turnover NO N/A N/A N/A Ability to pay debt in the short-term Ability to pay debt immediately Efficiency of collecting accounts receivables Efficiency of managing inventory Liquidity of receivables Liquidity of inventory Efficiency of assets in producing sales N/A N/A N/A - 60 6 Solvency Debt ratio Equity ratio Debt-to-equity ratio Times interest earned Proportion of total assets funded through liabilities Proportion of total assets funded through equity Ratio of liabilities to equity Creditors' risk of loan repayment with interest 32 Profitability Profit margin ratio Gross margin ratio Return on total assets Return on common stockholders' equity N/A Proportion of net income in each sales dollar Proportion of gross margin in each sales dollar Profitability of assets Profitability of owner investment N/A N/A Excellent Good Unacceptable REQUIRED COMPONENTS Average C Poor D SCORE Fully 0 - 15 pts developed opinion with clearly supported conclusions Opinion is made clear and conclusions are supported Conclusion is difficult to discern, not accurately developed or supported Lack of clear conclusion or assertion 0 - 20 pts Executive Summary: concise write-up outlining conclusions about company performance, important analysis results, etc. (2-3 paragraphs ) Analysis Overview: description of the company, its industry, the financial statements and other information used, key findings, other factors considered, any assumptions made. (1-2 pages) Skillful Identification identification and analysis of and analysis of relevant info, relevant info, mostly framed framed in the in the context context of of building building blocks blocks of of analysis analysis Conclusion(s) exists but not adequately supported, needs development Identification & description of relevant info, accurate but limited development of analysis, some building block context Only a general discussion of relevant info, indicates limited grasp of financial statement analysis Little or no discussion of relevant information, no use of building block framework


